Profit Ratio: Percentage of Traders in Profit
In our Tools section, in addition to those already available, you can find a tool called "Percentage of Traders in Profit" or, simply, Profit Ratio.


Profit Ratio is a tool developed according to the Order Book, so it will work best in conjunction with the signals of last.
Speaking of tool Profit Ratio, it is necessary to recall the ProfitRatio indicator. Highlights potential price reversal points on the chart based on winning/loss ratio.
So, if you haven't already looked at the tool, you can do it here:
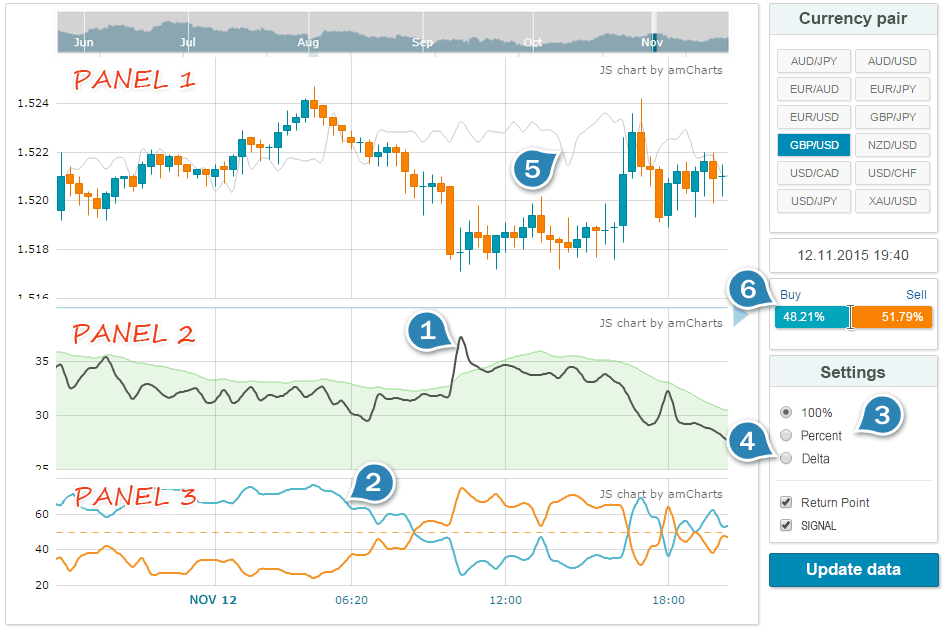
The tool comprises three panels:
- Panel 1 – price chart and chart of Return Point.
- Panel 2 – Profit Ratio chart and signal zone.
- Panel 3 – percentage of sellers and buyers – separately or delta.
Tool Features:
- Percentage of traders in profit (Profit Ratio).
- Profit ratio split into buyers and sellers (values from 0 to 100%).
- Profit ratio split into buyers and sellers (percentage of the total trading volume).
- The difference between the current and previous values of Profit Ratio (Delta).
- Return Point in the dynamics (Return Point).
- Ratio of open positions of traders (Ratio).
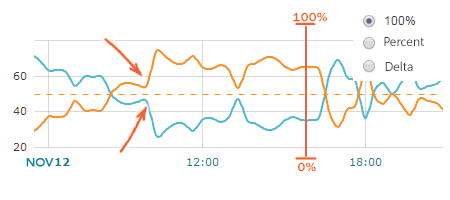
Percentage of Traders in Profit (Profit Ratio)
Such an indicator like Profit Ratio is the basis for the entire tool. This indicator generates good signals of reversal points or different kinds of situations where traders are “knocked out” of their positions.
It is calculated as follows:
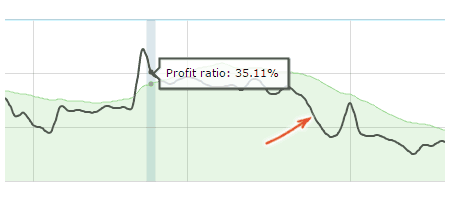
The percentage of winning traders is determined for each snapshot of the Order Book. The sequence of the values obtained forms a chart, which you can see just above.
This is how we analyze it:
- If the Profit Ratio (black line) goes beyond the green zone, it’s a signal for reversal.
- Trading direction is determined by the previous bar: if the bar is downward, you should buy; if the bar is upward, you should sell.
Note that the green signal zone is an ordinary arithmetic mean plus a small coefficient. Thus, the signal line is needed mostly for newbies, and we recommend more experienced traders to disable it.
Profit Ratio Split Into Buyers and Sellers
Split Profit Ratio for winning buyers and winning sellers.
There are two ways to display this data:
- From 0 to 100%. For example, Profit Ratio = 36%, from which 65% are buyers and 35% are sellers (100% in total).
- Percentage of the total trading volume. For example, Profit Ratio = 36%, in particular 26% are buyers and 10% are sellers (36% in total).
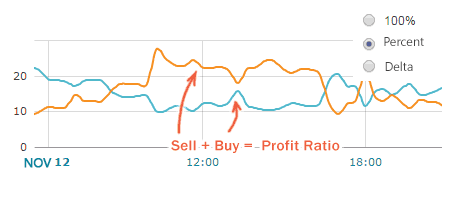
You can switch between these two chart types in the settings menu.
This is how we analyze it:
- If the Profit Ratio’s value has “gone through the roof”, and we can see that most winning traders are sellers, we should buy.
- If the Profit Ratio’s value has “gone through the roof”, and we can see that winning traders are mostly buyers, we should sell.
- If the Profit Ratio’s value doesn’t exceed the signal line, the prevailing buyers signal an uptrend, and the prevailing sellers signal a downtrend.
Delta Profit Ratio
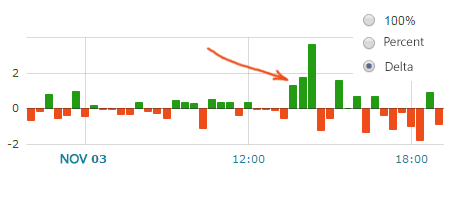
Delta is the difference between the current and previous values of the Profit Ratio.
You can see spikes in the Profit Ratio readings onthis chart.
This is how we analyze it:
- If Delta is greater than 2%, it’s a signal for possible reversal.
- Trading direction is determined by the previous bar: if the bar is downward, you should buy; if the bar is upward, you should sell.
The value of 2% has been selected for EUR/USD pair, and the values for other pairs may differ.
Return Point
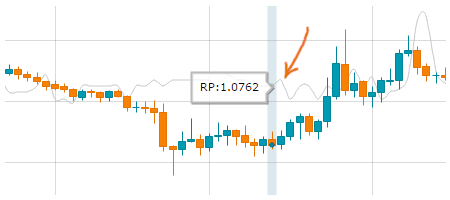
Return Point is the level where the number of winning traders is the smallest.
Earlier, we have published an article on the Return Point. Unlike DOM Snapshots, this tool displays the Return Point as a chart.
This is how we analyze it:
- Set Take Profit at the Return Point level.
- Use it as a direction vector. If the Return Point is above the price, you should buy; if the Return Point is below the price, you should sell.
The Return Point doesn’t work well after a strong impulse occurs, so it’s best to use it during a flat market.
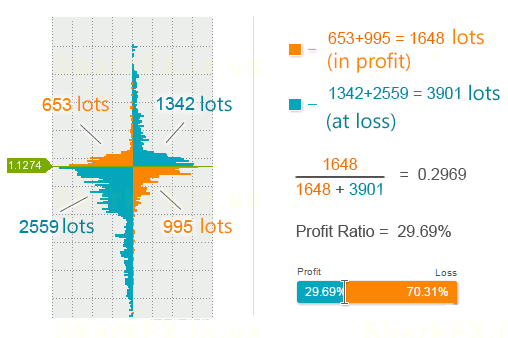
Ratio of Open Positions of Traders
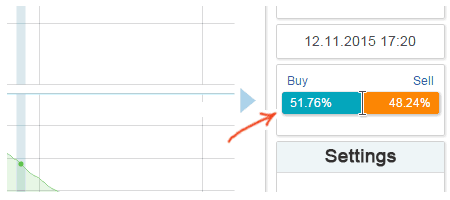
The picture shows the ratio of open positions of traders for Order Book. Here is an article describing this indicator.
This is how we analyze it:
- If most traders are long, you should sell.
- If most traders are short, you should buy.
In this tool, the ratio of positions plays an important role in the filtering of signals. For example, if the profit ratio’s value has “gone through the roof” and shown that winning traders are mostly sellers, but we can see that only 30% of traders in the market are sellers, it is better to ignore this signal.