FXSSI.OrderBook
FXSSI.OrderBook Screenshots (8)
FXSSI.OrderBook - Overview
Analyze the market sentiment directly in the MT4 and MT5 terminal with the advanced OrderBook indicator.
The indicator will allow you to:
- Identify the levels with the largest Stop Loss clusters;
- Evaluate the chances of bulls or bears to develop the “attack”;
- Distinguish false moves from the true ones;
- And much more.
The OrderBook indicator will become an indispensable assistant for any trader who practices trading against the market majority.
Many of our clients find this indicator indispensable, making it a crucial part of their market analysis toolkit.
OrderBook Indicator
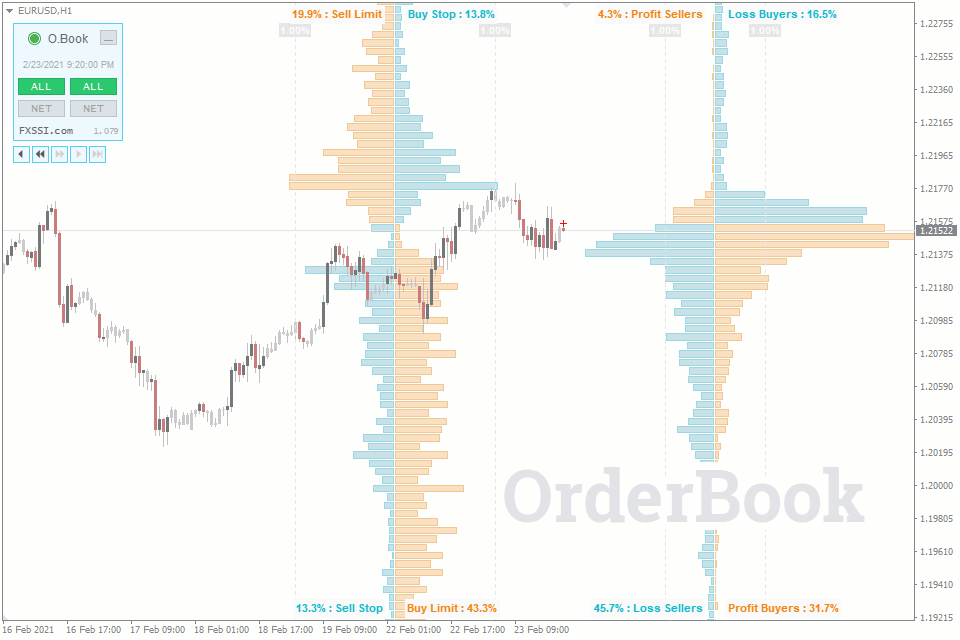
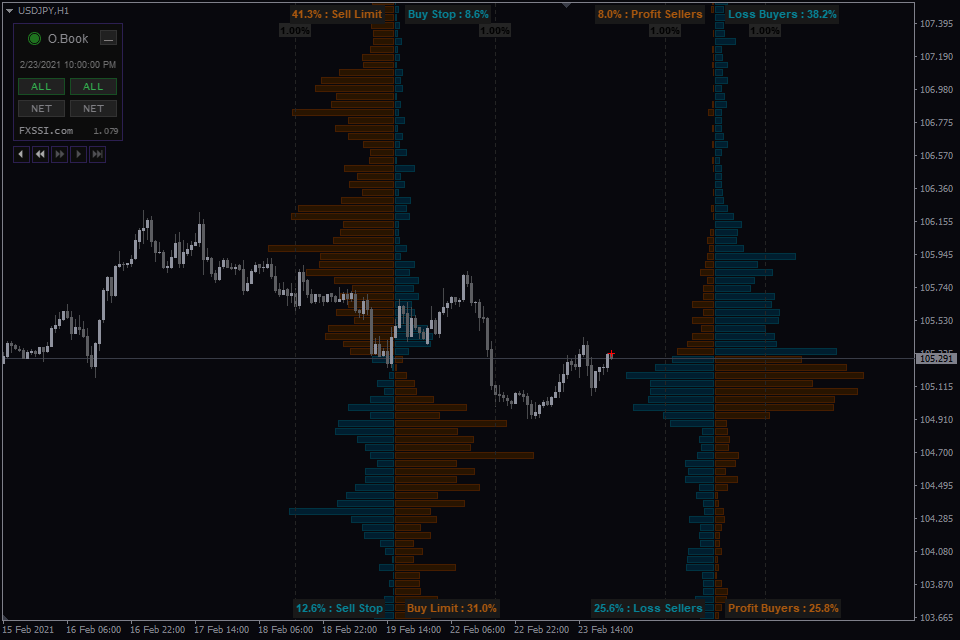
The OrderBook indicator displays open trades and pending orders of retail traders as a two-sided histogram. It is used for the comprehensive analysis of market sentiment for a particular financial instrument.
The OrderBook indicator consists of two parts:
- Left-side order book, which displays all pending orders, including Take Profits and Stop Losses.
- Right-side order book, which shows currently open trades of market participants.
The left order book further divide into quarters, each of which displays a specific order type, such as Sell Limit, Buy Stop, Profit Sellers or Loss Buyers, etc.
And the right histogram of OrderBook divides buyers and sellers into those in profit and those in loss.
By analyzing this kind of information and resorting to various patterns of the market crowd behavior, you can make complete trading decisions.
Trading With the OrderBook Indicator
First of all, you should understand that Order Book does not generate clear-cut signals like, for example, some indicators that draw arrows on the chart indicating Buy or Sell recommendations.
When it comes to the Order Book, the market analysis comes down to searching for existing or non-existing abnormal clusters among sellers and buyers.
The basic algorithm for the market analysis using the Order Book is as follows:

For Buy trades:
- Clusters of buyers’ Stop Losses attract the price;
- Dominant winning sellers pull the price up;
- Clusters of Buy Limit orders act as support;
- Dominant losing sellers push the price up.
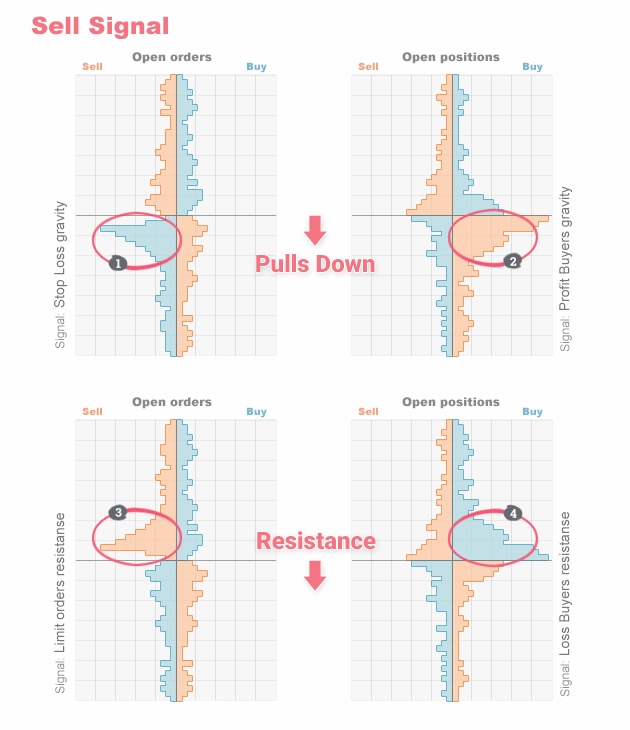
For Sell trades:
- Clusters of sellers’ Stop Losses attracts the price;
- Dominant winning buyers pull the price down;
- Clusters of Sell Limit orders act as resistance;
- Dominant losing buyers push the price down.
However, this doesn’t mean that you should immediately open a Sell trade when you see, for example, a cluster of winning buyers.
We can guarantee that at first, you'll see things in the market that aren't really there. With practice, you'll learn to tell which signals are real and reliable.
Trading with the Order Book needs a bit more detailed analysis for each market situation. You should examine the market to figure out who might be trying to manipulate whom. Once you have an idea, you can then look for a trading opportunity.
If you're interested in this indicator and you want to know more about it, our complete Order Book guide will help you understand the analysis technique and displayed data interpretation.
What Kind of Data Does the Indicator Show?
OrderBook is the visual representation of trading activity, namely, open trades, pending orders, and Stop orders.
At each price level, the trades are summed up and represented as a histogram. As a result, we get the following picture:

The picture shows the extended order book that includes all types of pending orders as well as open trades.
The original concept of the order book meant that only the first and fourth squares (i.e., only Limit orders) were displayed.
Adding other types of orders and forming a two-sided order book like in our case, was possible thanks to the customer base of a particular broker.
The ordinary stock exchanges cannot provide a two-sided order book since they don’t have the required information.
Indicator Features
The indicator was developed by a team of experienced traders and programmers, so it’s not only a program for data transfer but also a handy and effective tool for analyzing financial markets.
Here are some of the OrderBook indicator features:
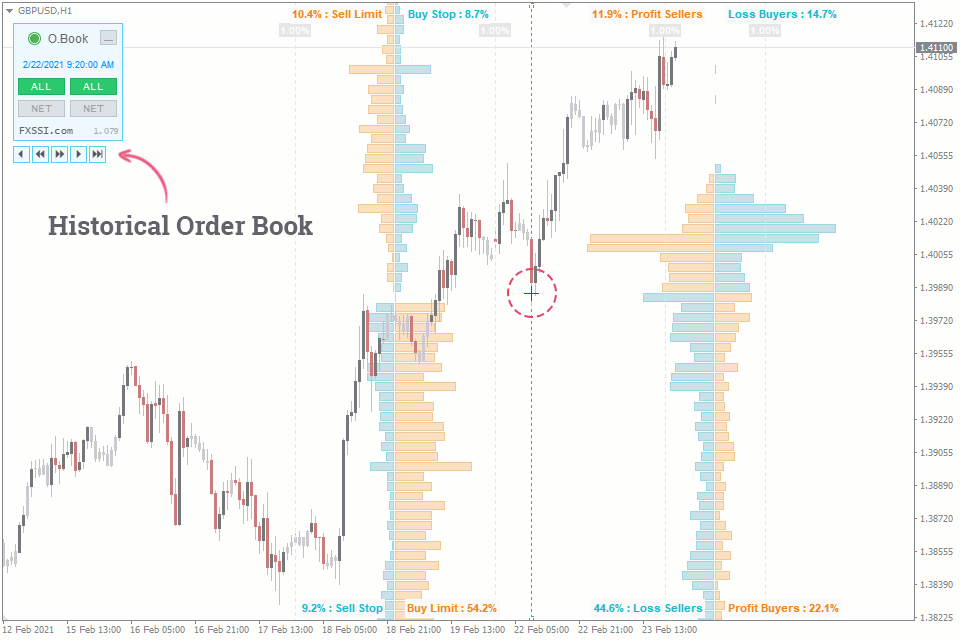
Snapshot time. The panel shows the time of the current OrderBook snapshot. It’s actually the time when the data was last updated. If the label is blue, the history navigation mode is enabled.
History navigation. The indicator allows you to navigate the history of snapshots. The maximum history depth depends on the selected subscription plan.

Red cross mark. A cross mark on top of the candlestick chart indicates the price and time at which the Order Book snapshot was made. It is also used to rewind the history of snapshots.
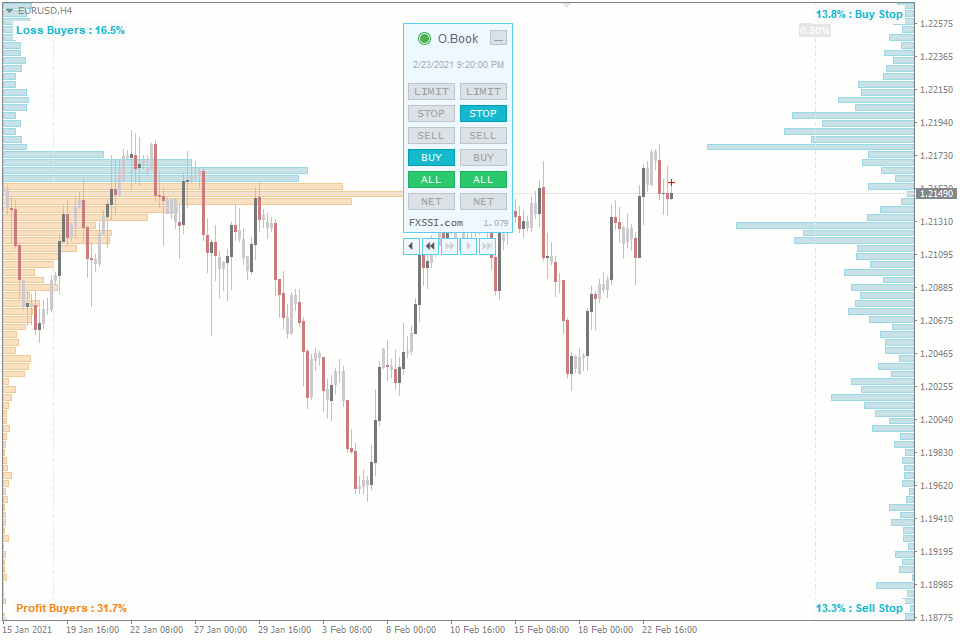
Fast access to data. Switch between modes using the buttons on the indicator panel. You don't have to go to the indicator settings to change the type of the displayed data.

The menu has the button to minimize the panel as well. You can set the minimized state of the panel as default in the indicator settings. It reduces the menu size in such a way as not to prevent you from making a candlestick analysis.
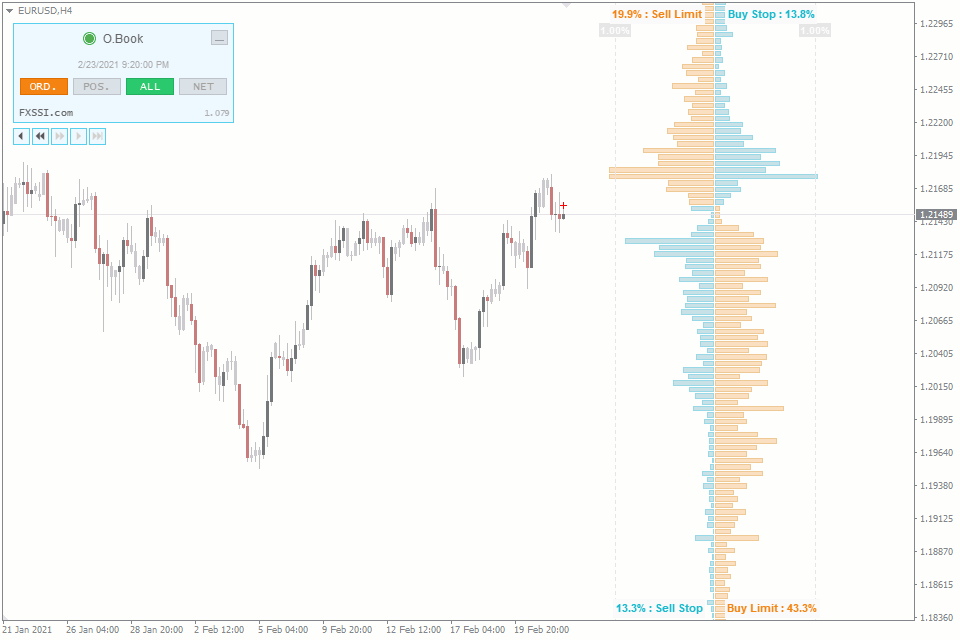
Four layouts. Simplified/classic, one-sided/two-sided. For more information, see the image below:

Auto settings. The indicator has a feature for the automatic detection of color scheme and time zone.
For your convenience, we have added the Automatic Indicators Update system. Now you only need to restart your terminal to get the latest versions. The indicator will inform you about it in a separate window.
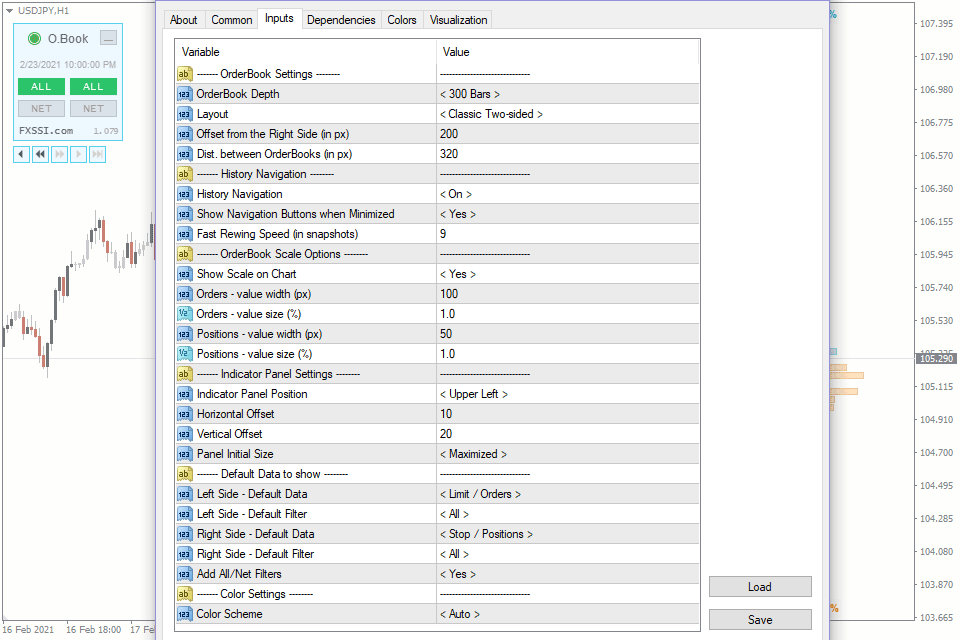
Indicator Settings
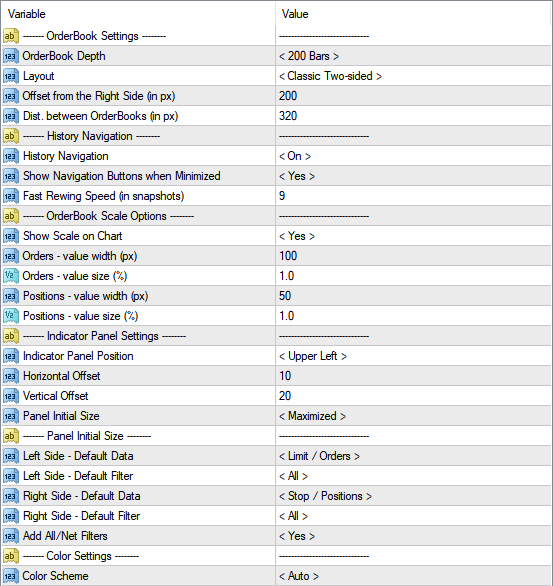
OrderBook Settings Block
OrderBook Depth. It sets the number of horizontal columns of the histogram. The higher the value, the larger the height of the order book.
Layout. There are four layout options available:
- Classic one-sided;
- Classic two-sided;
- Simplified one-sided;
- Simplified two-sided.
Offset from the Right Side, Dist. between OrderBooks. Both parameters set the location of the histograms on the chart.
History Navigation Block
History Navigation. Enables/disables navigation through cast history.
Show Navigation Buttons when Minimized. Determines whether the rewinding panel will be displayed when the main one is minimized.
Fast Rewind Speed (in snapshots). Sets the step for fast rewinding. You can enter the value at your discretion. It is measured in bars.
OrderBook Scale Options
Show Scale on Chart. Enables/disables the vertical bar-scale of the histogram.
Orders/Positions – value width/value size. They determine how far the vertical scale lines will be drawn from the middle of the order book.
Indicator Panel Settings
Indicator Panel Settings:
- Indicator Panel Position – selects the chart’s corner to place the indicator panel.
- Vertical, Horizontal Offset – sets the offset (in pixels) from the selected corner.
- Panel Initial Size – by default, it will maximize/minimize the panel when you start your terminal.
Data to show by Default
Left Side/Right Side – Default Data. Sets the default data type for the simplified display.
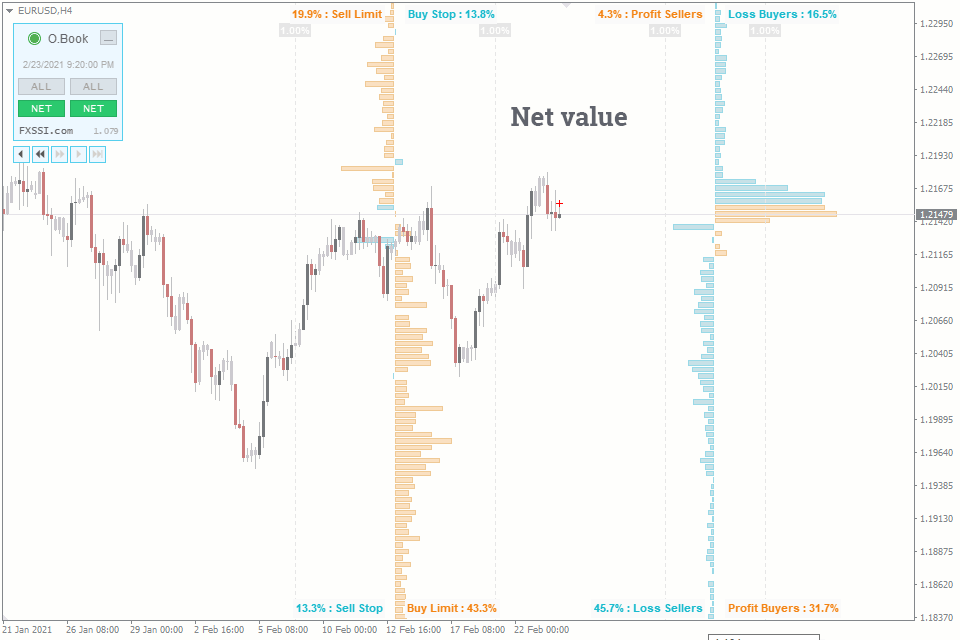
Left Side/Right Side – Default Filter. Shows all data or the net default value.
Add All/Net Filters. Enable/Disable the net value mode.
Color Settings
Color Scheme. By default, the indicator will automatically detect the color scheme depending on the chart background. If necessary, select the desired color scheme from the list.
- Stereotypes of the Market Crowd BehaviorJun. 6, 2022
- Order Book. Part 1. – Description of the ToolJul. 26, 2022
- What Is Stock Order Book. Is There One for the Forex Market?Jun. 6, 2022
- Order Book vs Futures VolumesJul. 31, 2021
- Sentiment Strategy: Beginner's GuideJun. 21, 2022
- Order Book TradingOct. 17, 2021
- Difference Between Classic Order Book and Extended Order BookOct. 17, 2021
How to add FXSSI.OrderBook in MT4/MT5
The FXSSI.OrderBook indicator is part of the "FXSSI Pro" package, which also includes several other professional indicators.
Follow the instructions below to install the "FXSSI Pro" indicators package to your MT4 terminal:
- Download the ZIP-archive with "FXSSI Pro" indicators by clicking the link at the top of the page;
- Extract the contents of the archive (indicator files and DLL library) to the MQL4/5 folder of your terminal;
- If the system offers you the File Replacement, click – Yes;
- Restart the MT4/MT5 terminal;
- Run the indicator by double-clicking its name in the MT4 Navigator;
- Check the "Allow DLL imports" box and click "OK";
- Go through the Authorization Procedure: click the "Authorize Link" that will appear after you first start the indicator, and sign in to your account;
- The indicator will be displayed on the chart;
- Adjust the indicator settings according to your needs: press CTRL+I, select the indicator from the list and switch to the "Inputs" tab.
If you have any difficulties while installing the indicator, please view the detailed instruction.