Order Book vs Futures Volumes
In this article, we’re going to compare two most effective methods of analyzing the financial markets: Order Book and Volumes.
Only data from real markets can generate truly effective signals, and it doesn’t make sense what kind of format these data have.
These data may represent a customer database of an individual broker, as in the case of Oanda broker, currency futures volumes from the CME market, data on options or even CoT reports.
All of this applies to the real market and in theory should work much better than any other techniques based on a simple analysis of candlesticks.
The point is that hundreds of thousands of large and small market participants are behind these figures, and it’s their own actions that move the price.
Imagine that a large number of traders have recognized some pattern on the chart and, as a result, opened a lot of Sell trades. Will we be able to see it in the order book and the volumes? Yes, we’ll see.
The same is true for all other techniques of technical analysis. If a signal forms in accordance with any technique, the market response reflected in the volumes and the order book will be or not visible. You won’t follow each technique separately, since there are a lot of them, will you? As for exchange information, it brings everything together. You won’t need to look through dozens of indicators and seek for exotic “animals” on the chart. You just need to look into the order book to see the final result achieved by all the different kinds of techniques followed by traders.
Roughly speaking, the exchange information is the first instance, and everything else is derivative instruments. If you can see “Head and Shoulders” pattern signaling a downward direction, and there are no any changes in the exchange information due to this, the price won’t response to the “Head and Shoulders” pattern.
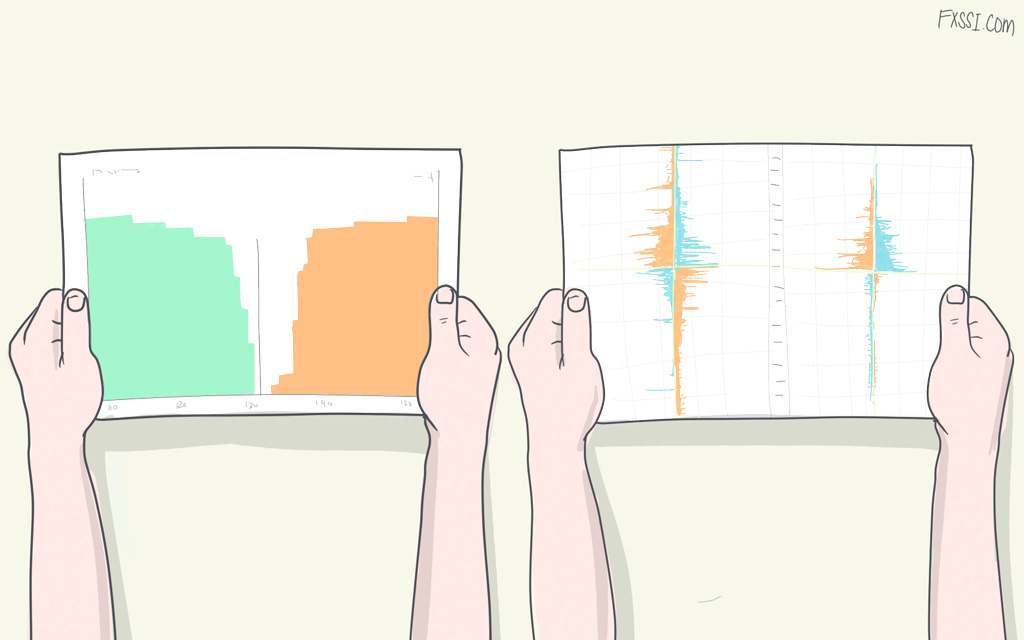
Volumes
Futures volumes Forex is the summary information on the number, the lot size and the opening price of trades made in the market. In general, they are somewhat similar to the open interest, since they also represent the sum of all trades (Buy and Sell).
These data have the “past” nature, except for the “cut short” order book. In other words, the volumes tell us only about what happened, but not about what is going to happen.
Another feature of the volumes is that they don’t indicate a trade direction. We can see whether or not the volume is in the market, but we have to think on our own what kind of direction the volumes signal.
What about delta? Delta displays the difference between market Buy and Sell orders, but if we take into account that there is the same limit order opened in the opposite direction is behind each market order, the output will be the same number of Buy and Sell orders. All traders know that market orders are covered by limit orders, don’t they? If you don’t know it, please read article What is Stock Order Book.
We believe that the delta is virtually useless most of the time, because it can be easily manipulated. However, it can work in narrow places where the price stays for a short time, and we can say for sure what the crowd was doing at this point in time – whether it entered at the market price or opened limit orders. We’ll get back to the delta a bit later, so let’s continue on the subject.
All the methods of volume analysis can be divided into two main categories:
- Analysis of the crowd behavior.
- Search for major player.
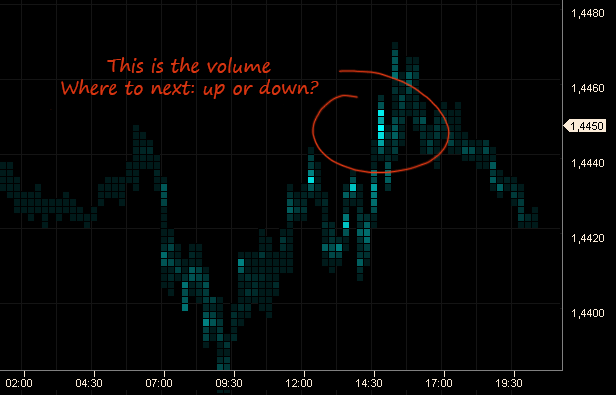
Unlike the order book, we can really see a major player in the volumes. No matter how hard it tried to conceal its presence, but if it wants to buy 1,000 lots, these 1,000 lots will have to come to light somewhere in the volumes. Most likely, it will not be a single trade, but still.
This is where the central problem of the volumes immediately comes up. Okay, we’ve seen 1,000 lots and know that it’s a major player. What direction is it trading in, if it has opened a market order of 500 lots and a limit order of another 500 lots? It can be both buying and selling.
High volume spots, at the sight of which you can safely open a trade or lock in profits of an already open trade, are common in the market. However, it requires that a trader always sit in front of the computer, and the volumes themselves are good only for day trading.
So, let’s summarize what we know so far about the volumes:
- They show the data on the past activity only.
- They don’t explicitly indicate a trade direction.
- They enable recognition of a major player.
- They enable opening a trade when the impulse starts to form.
- They require manual closing of a trade and sitting in front of the computer screen all the time.
Order Book
As we have mentioned here at FXSSI we use OrderBook indicator as the main tool for analyzing market sentiment.
The order book we’re studying is a relatively new tool. Previously, traders could only dream of the opportunity to know where their colleagues set their Stop Losses or opened their trades. All that was made available to them was an exchange order book showing limit orders. By the way, we assign the least weight to limit orders among all the signals generated by the order book.
Unlike the volumes, the order book tells us what is going to happen in the future. We can see the levels where trades will be opened and closed. Already open trades, which can be seen in the right-side order book, also have a forecasting nature. If 70% of traders are long, they will soon have to close their trades by making Sell trades.
All the signals generated by the order book have a clearly defined trade direction, but their strength may differ. For example, a cluster of Stop Losses is more important than that of limit orders, or a large cluster of Stop Losses will more likely be triggered than a small one, etc.
The order book displays exclusively opinion of the crowd, so the main idea is that when we act against the crowd, we do it in league with a market maker. One can come across major players in the order book, but they are not large enough to influence the price movement.
The order book provides reasonable points for setting Stop Losses and Take Profits that really work:
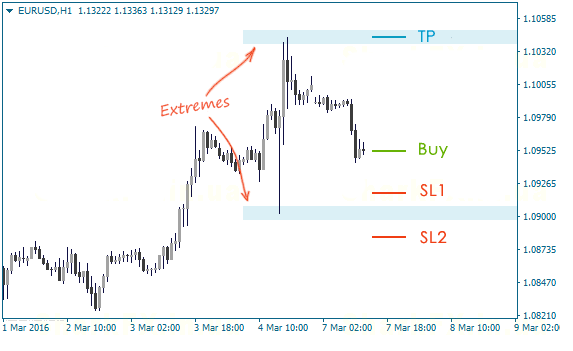
Summary of the order book:
- It provides data telling us what is going to happen in the future.
- It gives a clear direction to make a trade.
- Only the actions of the crowd are visible.
- There are difficulties in determining entry points with the order book.
- It indicates reasonable levels to exit a trade.
Interaction of Techniques
As you may have guessed, each of the presented techniques has its pros and cons. If so, why not try to complement them?
For example, the first thing that comes to mind is to determine the direction and the target of a trade with the order book and seek for a more accurate entry point in the volumes.
Another good example of interaction of the techniques can be a “search for answers”. If Stop Losses are knocked out in the order book, the volumes might tell you the reason for that: move the price in the opposite direction or accelerate the current price movement.
In theory, if a major player decided to take advantage of the crowd’s Stop Losses in order to open its position, we can see the delta of a rather high value at this level and the subsequent reversal. Of course, it’s not necessary that the reversal will start exactly from the level where Stop Losses are set – pushing the price for a couple of points further is possible.
Let’s look at this example. The situation before:
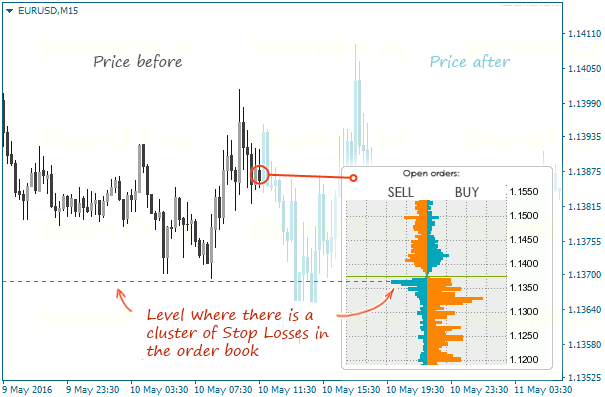
After Stop Losses are triggered, we should look at the volumes, or rather, the delta at the level where we have previously seen the cluster of Stop Losses:
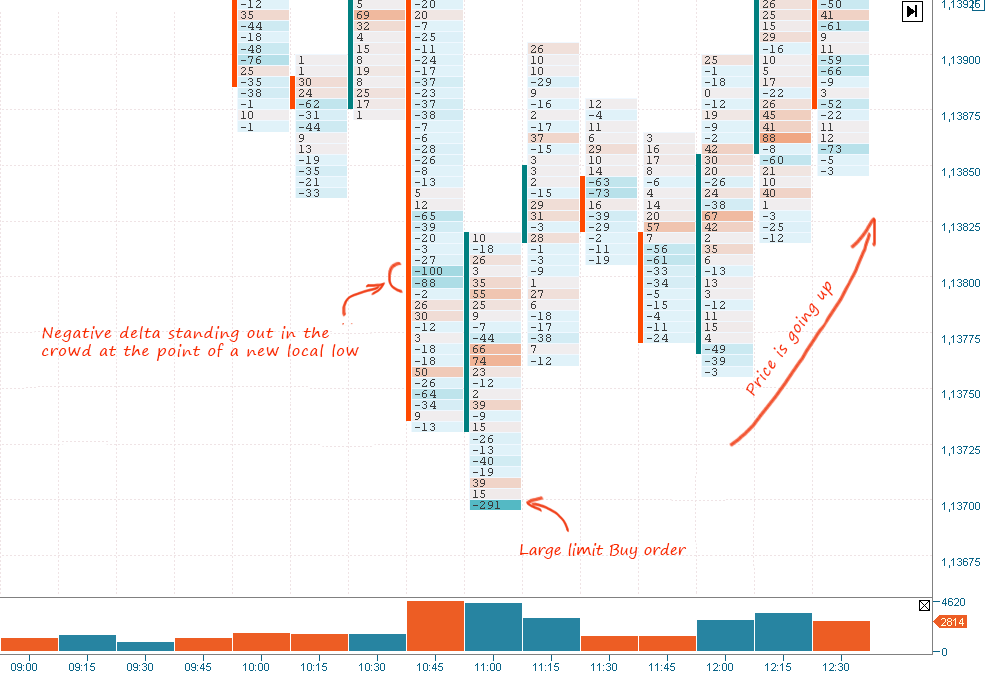
Let’s take a closer look. Since the level at which the price makes a new extreme (high/low) is a “narrow neck”, where the price never stays for a long time, and trading activity is present, a major player often comes to light. So, when the price hits the level with Stop Losses, active selling at the market price begins. If a major player intends on moving the price upwards, it simply cannot but take advantage of this “tidbit”. It triggers all these Sell trades with a limit order, and we can see the negative delta as a result.
By the way, we can see a “large limit order” supporting the previous idea just below.
An important element of such analysis is interpretation, or rather, forecasting the levels where “one-sided” crowd activity is going (the crowd buys or sells).
We can assume that the negative delta at the point of making a new low or the positive delta at the point of making a new high means that the price will more likely come back after Sop Losses are triggered. This is purely hypothetical thing proved theoretically – we need to study how it will manifest itself in practice.
Here you can see the price making a new high that triggered Stop Losses – it’s explained by the fact that a market maker finds it more interesting to keep moving the price in the current direction, but not to reverse it:
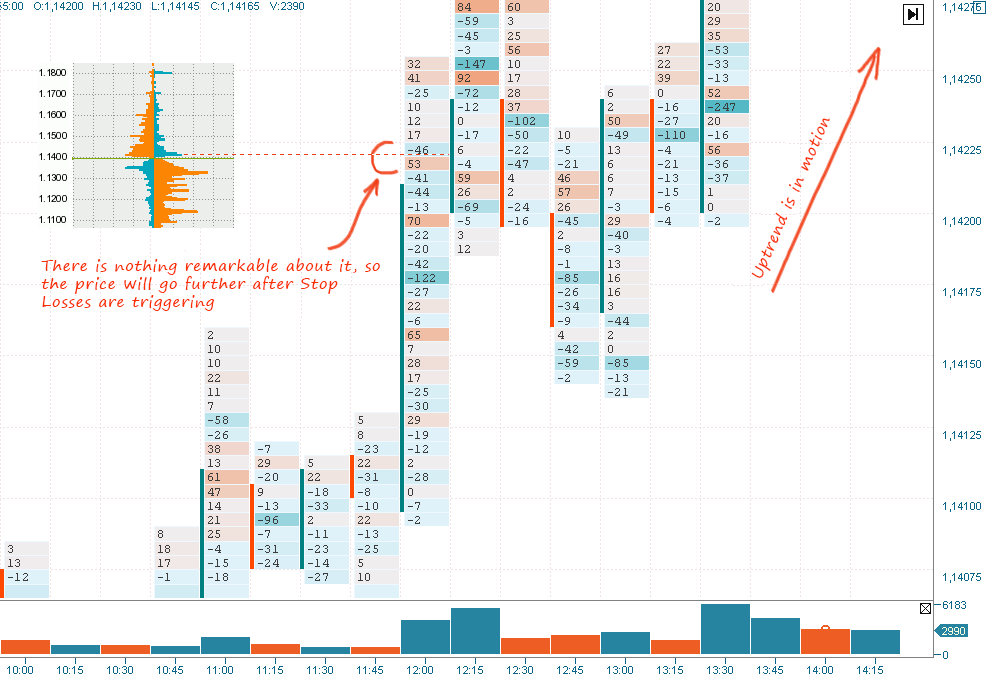
Why won’t we be able to see anything “remarkable” in this situation? Since a major player is planning to start the price upward movement (buying), Stop Losses (being also positions to buy) are not very good for adding to a position. On the other hand, these Stop Losses are very helpful in pushing the price upwards or just neutralizing the “downward attempts”. Further, the price just keeps going in the desired direction.
It’s only one of the options as to how apply the volumes in conjunction with the order book.
Links to the resources from the article: