Modern View on Classic Forex Patterns
Forex patterns are price models which often repeat in the market and result in certain regularity in the future price behavior.


In other words, pattern-based trading should give a percentage advantage in determining the direction of the subsequent price movement.
Why are Patterns Formed on the Chart?
The root cause of a technical analysis pattern occurrence is human psychology. A man visually draws a line/pattern within which the price is moving and subconsciously wants to continue drawing it. When the price tries to go outside the pattern border, most traders consider it a good point to enter the market and “push” the price back inside the pattern’s range by making their trades. Speaking of modern trends, it should be noted that it becomes clear that patterns are not as “beautiful” as before and are formed less often since a large number of trading robots (Automated Trading Systems, ATS) appeared in the market have difficulties understanding the previous statements.
Problems of Classical Patterns in the Modern Forex Market
- You enter a trade based on a classical strategy when the price has already made a good impulse move or at the level where the price might trigger your pending order by forming a spike and go away.
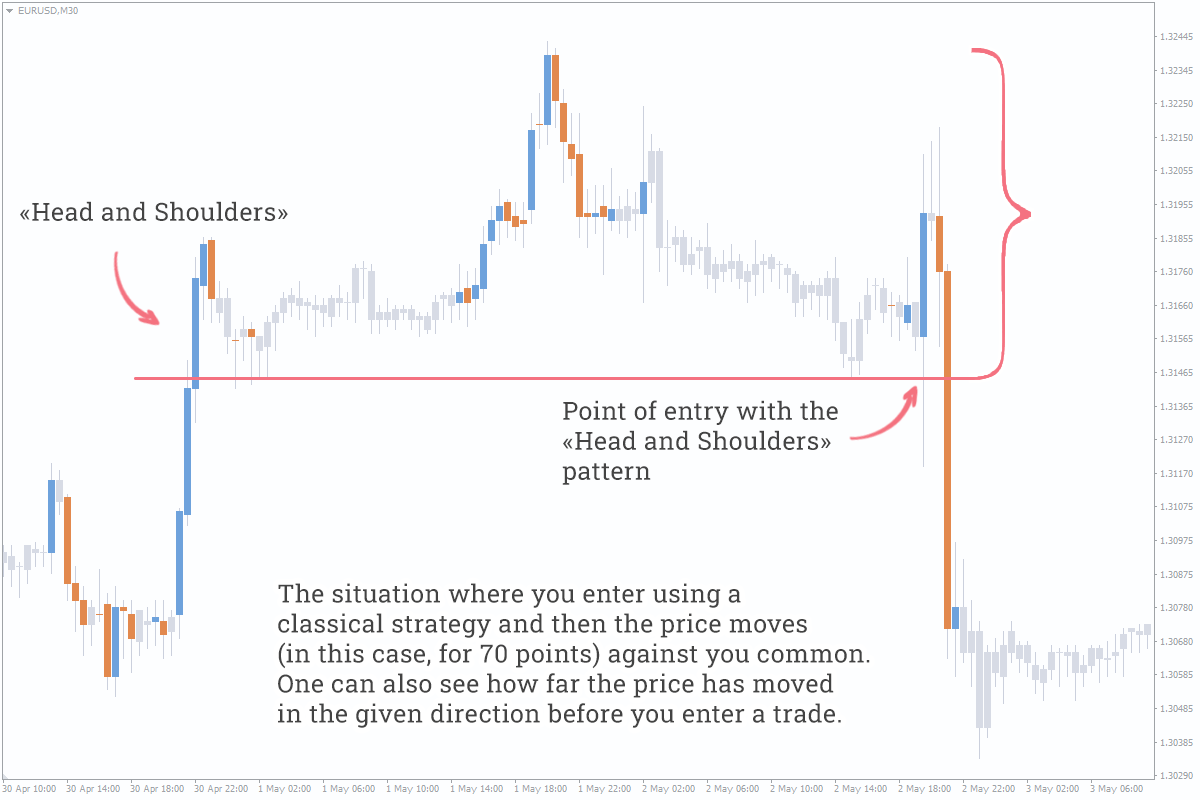
- Patterns often overlap each other and simultaneously generate the opposite signals.
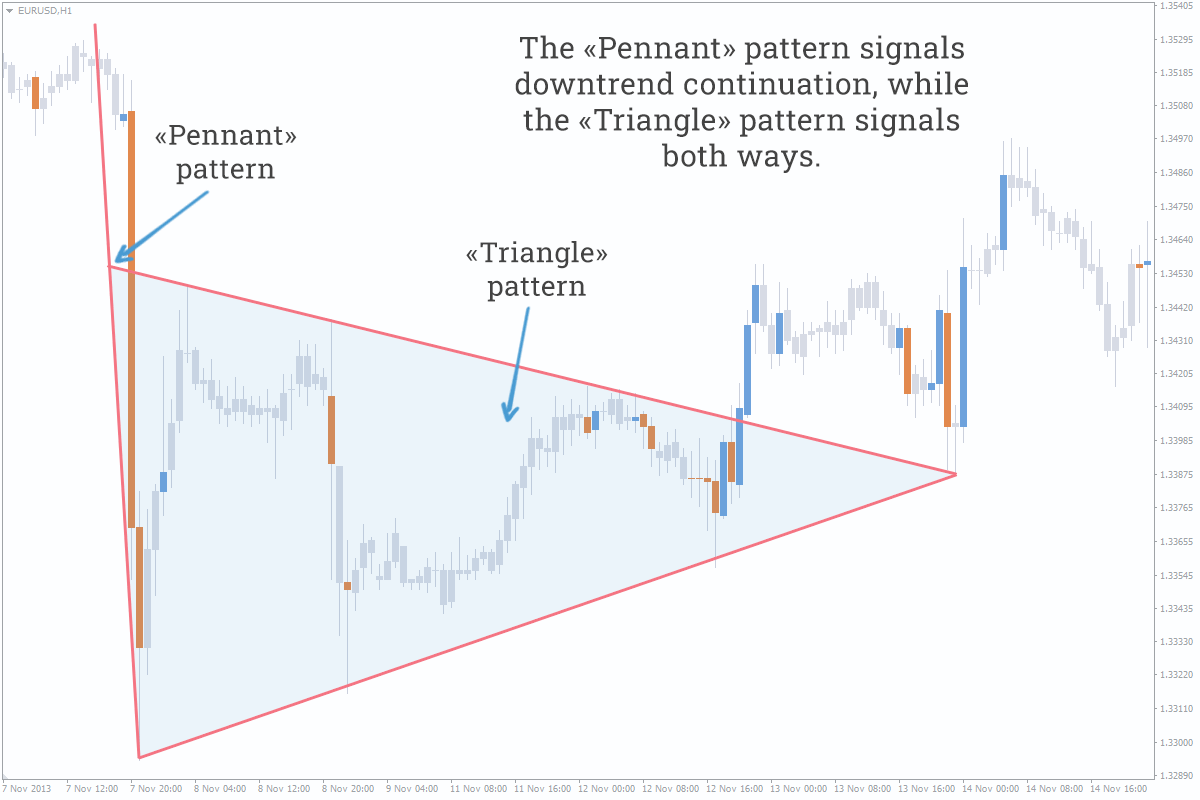
- Materialization of classical pattern is abstract – in practice, it’ll more likely materialize up to the nearest level.
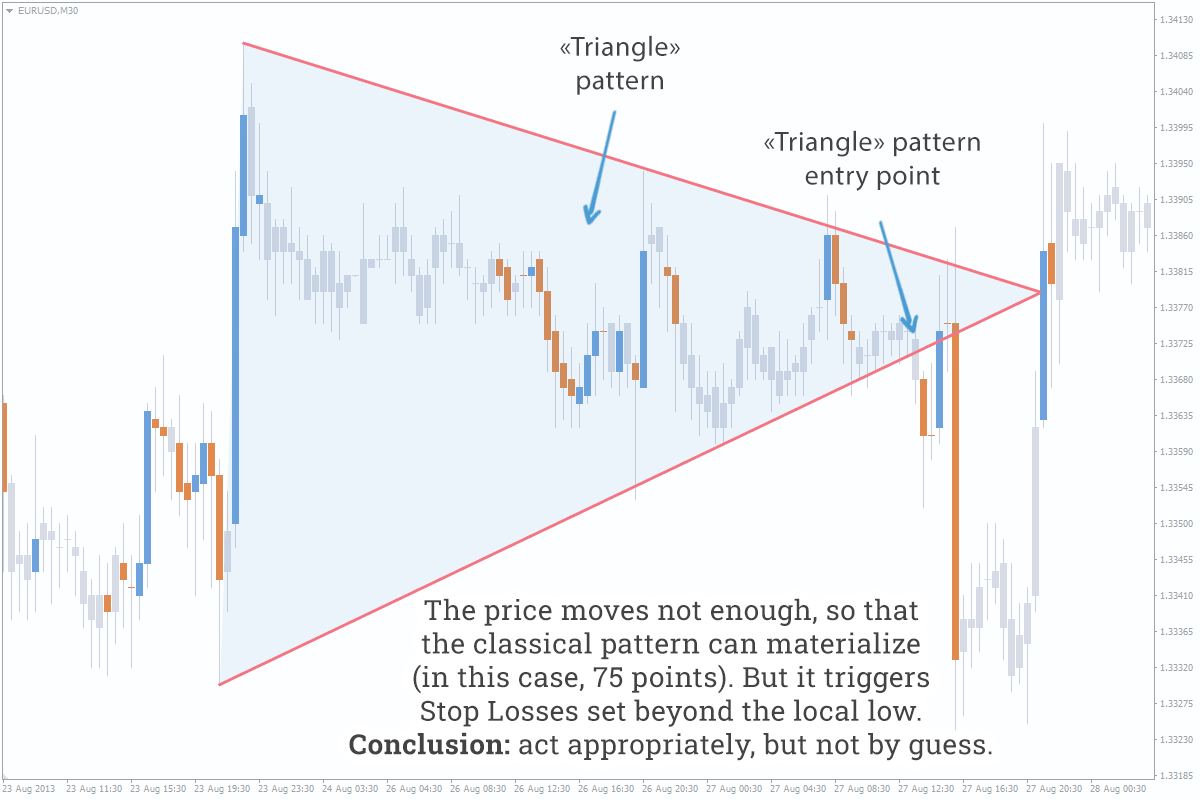
- We often look for/see formations where there are none. The market can transform into another pattern or simply ignore the formation, indicating that patterns should be used as an additional tool for analysis.
- In fact, the degree of classical patterns materialization hardly exceeds 50%.
How to Trade Patterns?
You shouldn’t fanatically look for patterns on the chart – you’ll be able to see them with the naked eye after you’ve got some practice. Now let’s get to the point: problems with patterns hint at their meaninglessness. However, there is a reason why it is necessary to plot patterns on the chart – it’s much easier to draw up several scenarios of price behavior when a pattern is being formed and materializing than when you deal with the naked chart without regularities. Here is an explanation of it: most traders see a pattern and place their orders/Stop Losses according to its rules, thereby creating clusters of orders, and the price, as you know, moves from cluster to cluster – as a result, we have two scenarios, namely, materialization or breaking of chart model.
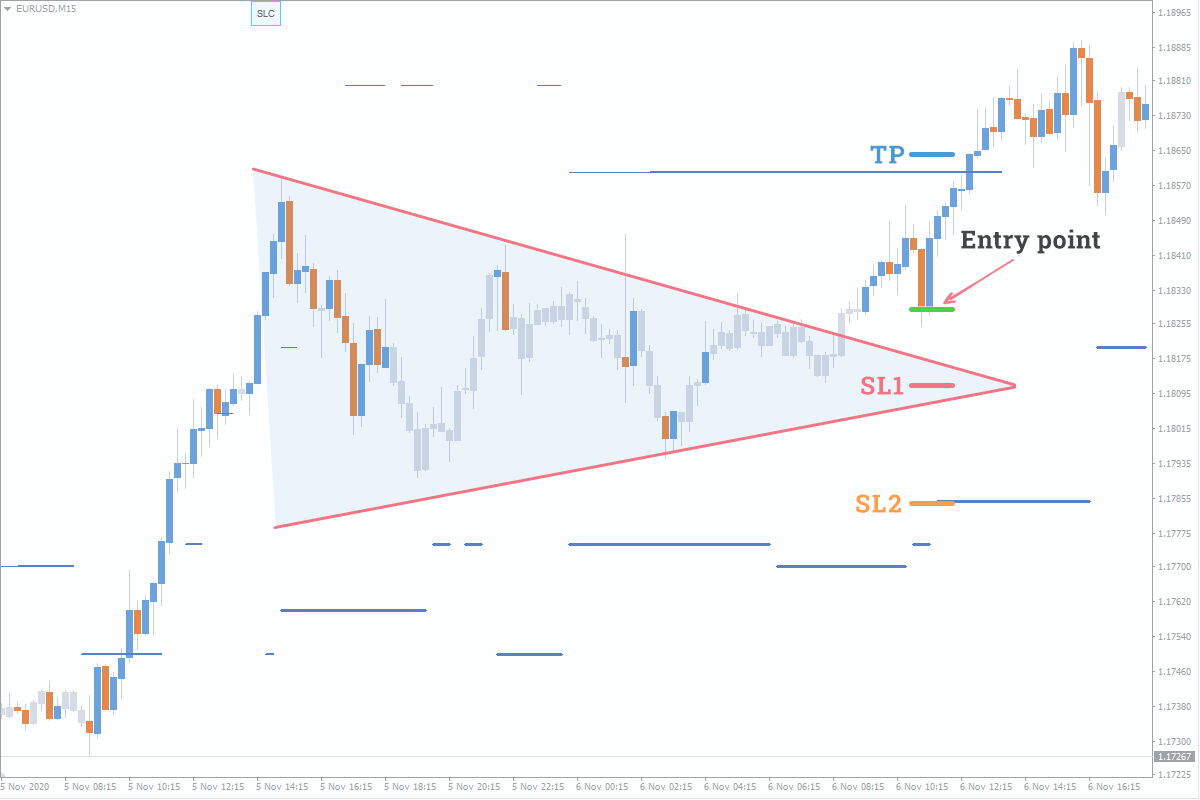
Here is an example of practical analysis: let's say we have a Buy signal (in this case, we have been really looking for entry point, because we have got a Buy signal, and the “Triangle” pattern has occurred at just the right time). Continued in the picture:
- We can see the formation process of the "Triangle" pattern and the cluster of orders, indicating that the crowd sees the pattern;
- Here you can see brekout of the line forming the "Triangle" and pullback to it;
- We set Stop Loss (SL1) inside the pattern's range and Take Profit (TP) above the local high. The SL/TP ratio of 1:2 is a good trade (Entry point);
- Without seeing the pattern, we would rather set such Stop Loss (SL2) that would change the SL/TP ratio to 3:2. It makes a considerable difference to us.
Let’s sum it up: you need to know the classical strategy (for general educational purposes), but you shouldn’t trade with them alone; the signals to enter/exit a trade should be looked for in another more informative tool, for example, in the portfolio of orders, the ratio of traders’ positions, and trading volumes. We also note that the more complex the pattern, the more meaningless it is. Why? How Does Market Makers See the Market?.
Pattern Types
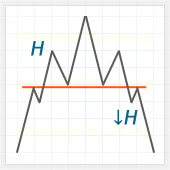
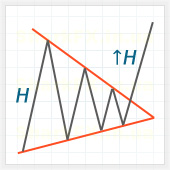
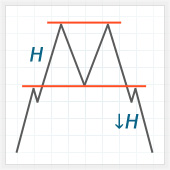
Chart models are classified by their influence on a trend – continuation, reversal, and two-sided patterns. We want to remind you of a widespread statement: “Trend will more likely to continue than to reverse.” Therefore, continuation patterns are more efficient than reversal ones.
Summary table and a cheat sheet on Forex trading patterns (all the links below are clickable):
Reversal patterns |
Continuation patterns |
Two-sided patterns |
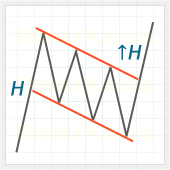
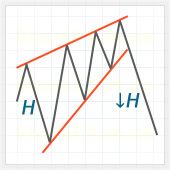
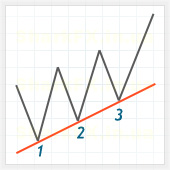
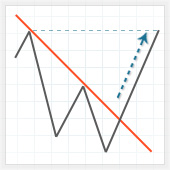
| Head and Shoulders | Pennant | Triangle |
| Double Top, Bottom | Flag | |
| Wedge | Three Indians | |
| Dragon |

