Fibonacci Trading Strategy: Some Tips to Improve Your Trading
Fibonacci tools are the most under-utilized tools in the trader’s arsenal. However, in this article, we will explore the major Fibonacci trading strategies used by the Pros.

Although we have earlier covered all you need to understand all the Fibonacci tools and get started with using the Fibonacci retracement tool in our blog posts, this article will dive deep into various Fibonacci trading strategies you can start using today.
Whether you are looking to add an extra confluence to your current trading system or you are looking to change your trading strategy entirely, this article is for you. So, let's get started!
#1 Fibonacci Retracement and EMA Strategy
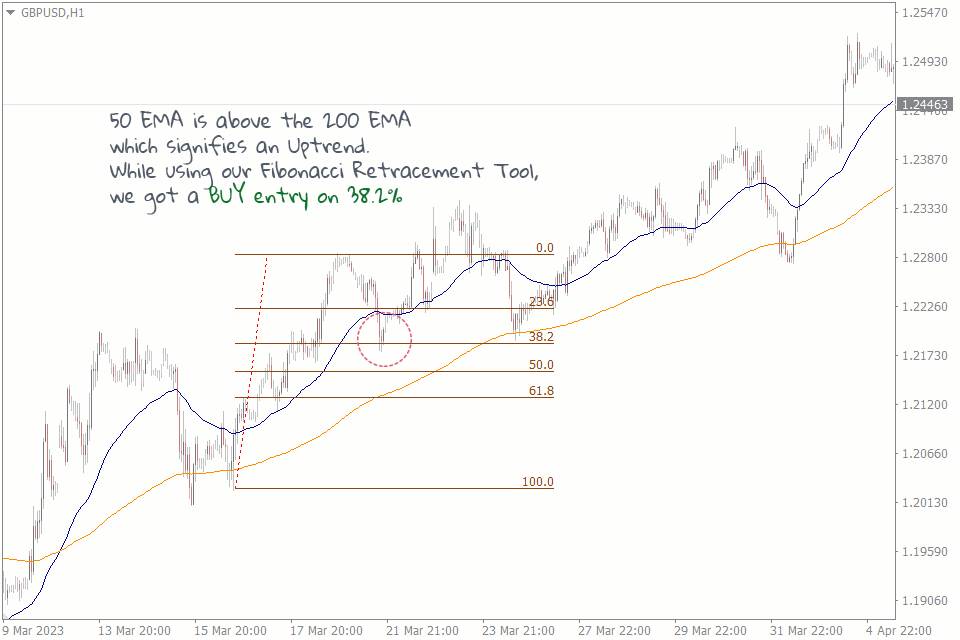
This Fibonacci retracement strategy is suitable for intraday traders. It uses the Fibonacci tool to identify key levels of support and resistance and the Exponential Moving Average to identify the trend. Here's how it works:
Knowing the trend brings clarity to the direction of our entry. For example, if we are in a downtrend, we will anticipate the Fibonacci key levels to act as support zones from where we can expect a buy trade setup.
For this strategy, you will be using the 50 EMA and the 200 EMA. Whenever the 50 EMA is above the 200 EMA, the market is in an uptrend. Whenever the 200 EMA is above the 50-day EMA, the market is in a downtrend.
Next, you'll draw the Fibonacci retracement levels in the direction of the trend to identify key levels of support and resistance. You can use 38.2%, 50%, or 61.8% Fib levels (The Fibonacci golden zone) as a potential entry and exit point.
Once you've identified the key levels, you'll wait for a retracement. This is when the price pulls back to one of the Fibonacci levels, and you enter the trade from there.
#2 Fibonacci Retracement and Support and Resistance Strategy
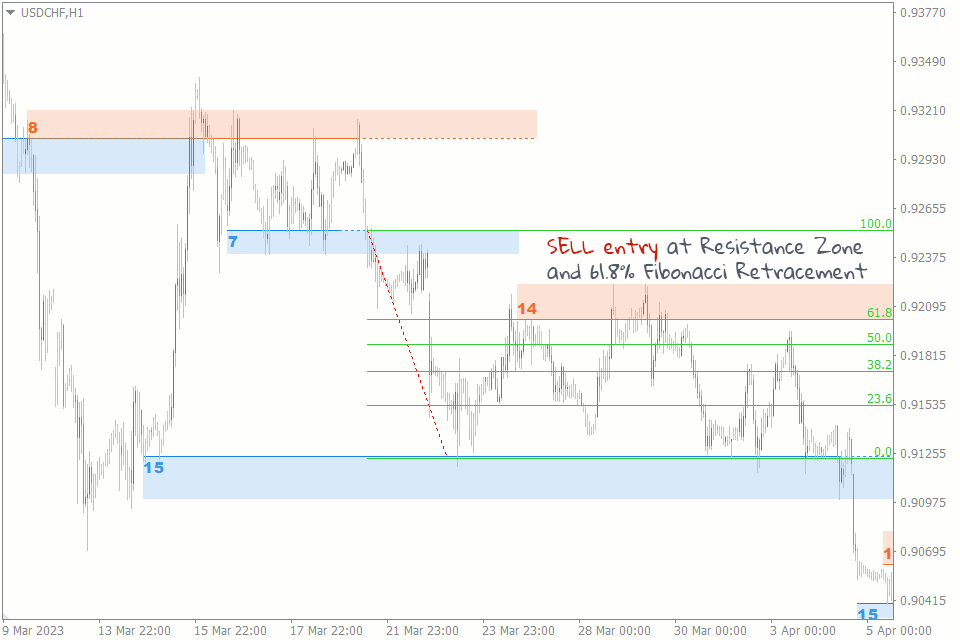
The second strategy is the Fibonacci retracement and support and resistance strategy. Trading support and Resistance on their own can be pretty profitable, but adding the Fibonacci retracement tool as a confluence can dramatically increase your win rate. Here's how it works:
First, you need to identify the key levels of support and resistance on the chart. You can use our Support and Resistance Indicator to do this.
You'll draw the Fibonacci retracement levels on the chart to confirm key support and resistance levels. You can use the 38.2%, 50%, and 61.8% levels as potential entry points.
Once you've identified the key levels, you'll wait for a retracement. If the price retraces to a support or resistance level, it's an excellent opportunity to enter a trade in the direction of the trend. This strategy can also be used to trade the breakout of those zones.
#3 Fibonacci Expansion and Trendline Strategy
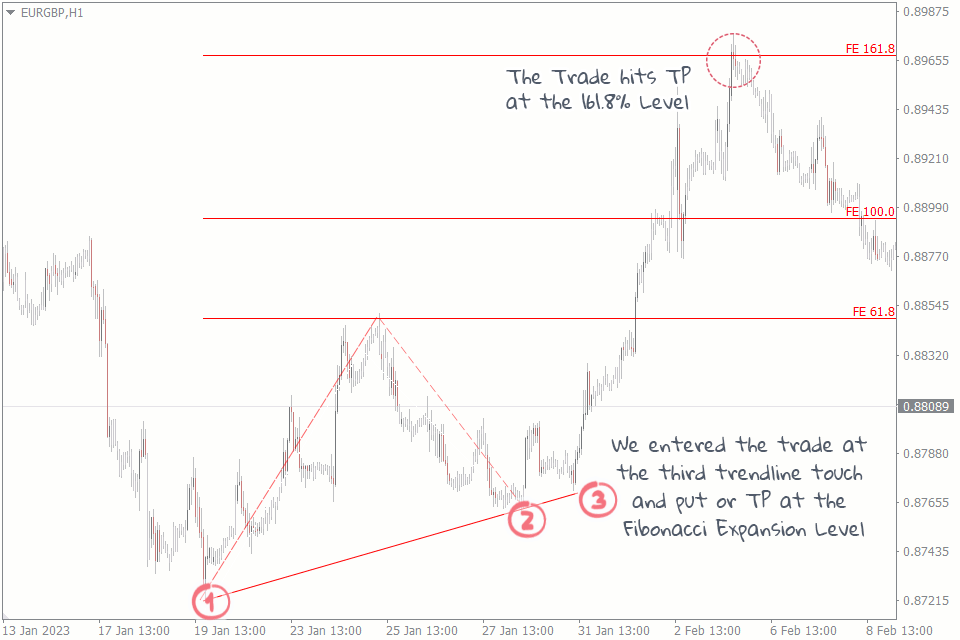
Using the Fibonacci expansion tool with a trendline or channel to identify potential price targets is one of the best ways to determine precisely where to exit the market in forex.
We first identify the trend and entry point by drawing a line, connecting the swing lows of the price action. Next, we use the Fibonacci expansion tool to identify potential price targets of the trend. We draw the price extension from the swing low to the swing high of the trend.
Finally, we look for potential exit points using the Fibonacci expansion levels as our price targets. We consider taking profit at the 61.8%, 100%, or 161.8% Fibonacci expansion level.
#4 Fibonacci Arcs and Pivot Points Strategy
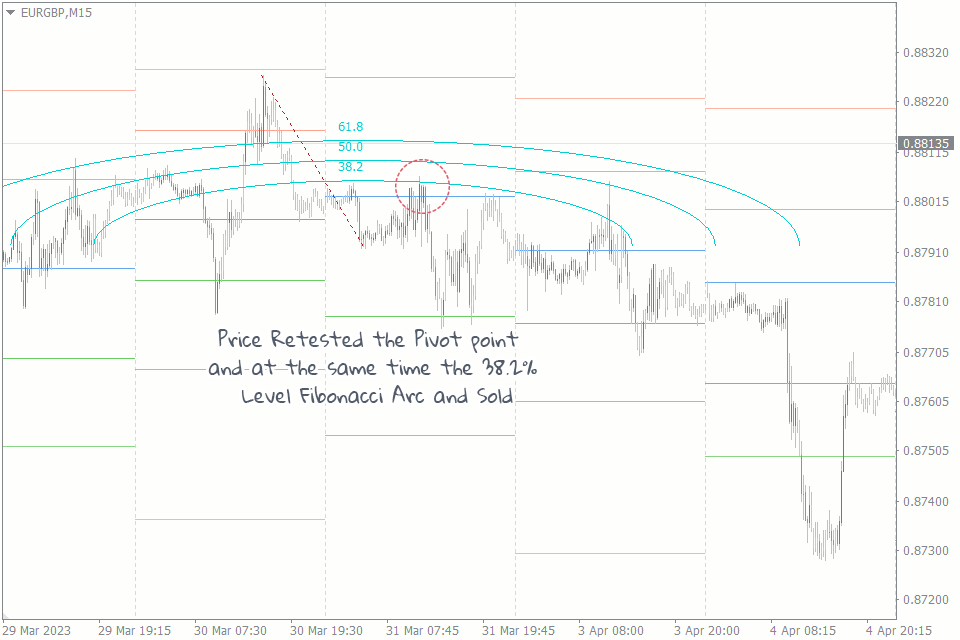
In this intraday forex strategy, we will use the Fibonacci arc and pivot points to identify potential support and resistance levels.
We start by identifying the pivot point using the previous day's high, low, and close, or download the indicator from here for free. Next, we draw the Fibonacci arcs by using the swing high and low as the end points.
Lastly, we look for potential entry points by using the Fibonacci arcs as our support and resistance levels. We consider selling/buying opportunities at the 38.2%, 50%, or 61.8% Fibonacci arc level, depending on the market's trend.
We place our stop loss above the previous day's high in a short position and below the previous day's low in a long position.
#5 Fibonacci Expansion and Ichimoku Kumo Twist Strategy
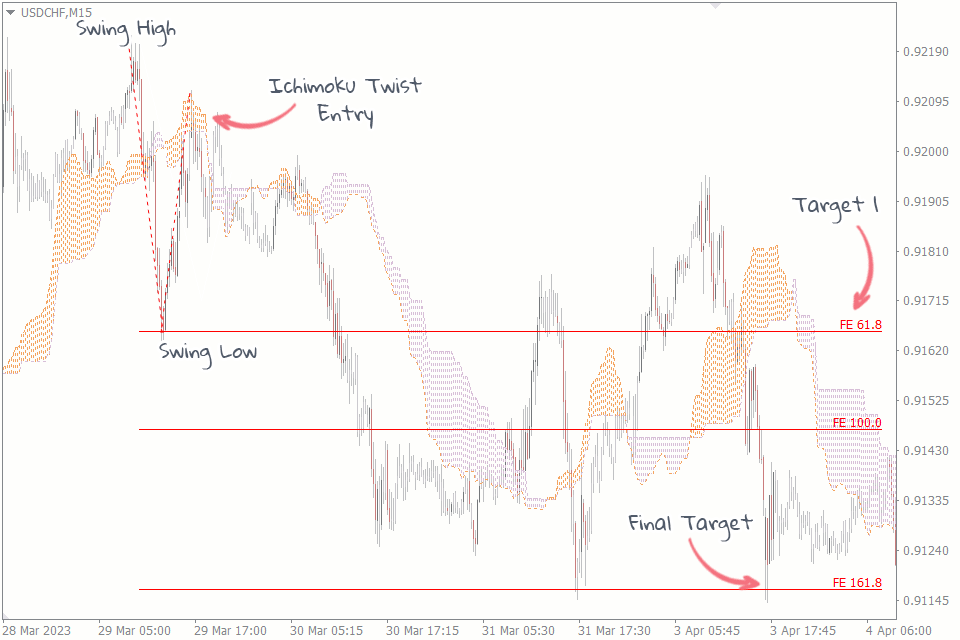
The Ichimoku Kumo Twist is a popular technical analysis scalping signal used to identify potential trend reversals in any time frame. It occurs when the two lines that make up the Ichimoku Cloud cross over each other.
First, we identify the direction of the trend by looking at the price position relative to the Ichimoku Cloud. If the price is above the Cloud, we consider the trend to be bullish, and if the price is below the Cloud, we consider the trend to be bearish.
Next, we draw the Fibonacci expansion tool by using the swing low and the swing high of the trend. We start from the swing high and draw the expansion tool to the swing low in a downtrend.
Finally, we look for potential entry and exit points by using the Fibonacci expansion levels as our support and resistance levels.
In a bearish trend, we consider selling opportunities when the candle breaks below the Cloud and the Kumo Twist occurs, and we place our stop loss above the Cloud.
We exit the trade when the price reaches 61.8%, 100%, or 161.8% Fibonacci expansion level. The opposite is also true for a bullish trend.
#6 Fibonacci Bollinger Bands Strategy
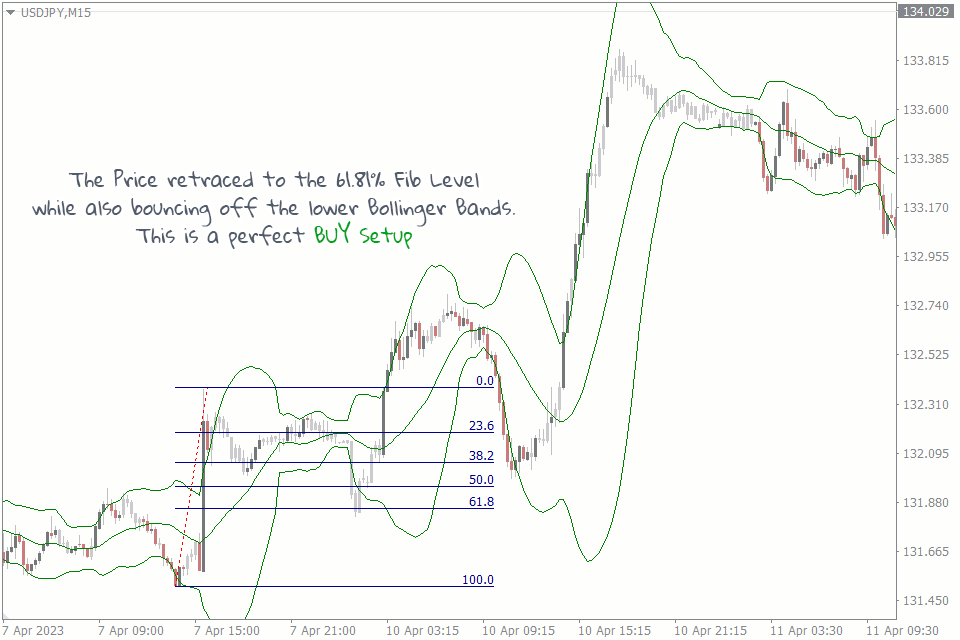
For this strategy, traders identify the key Fibonacci retracement levels on their chart. These levels are typically 38.2%, 50%, and 61.8% of the previous price swing.
Once these levels are identified, traders add Bollinger Bands to their chart. Bollinger Bands are a volatility-based technical indicator that helps traders identify the market's upper and lower boundaries.
When the price is near a key Fibonacci retracement level, traders wait for the price to touch either the upper or lower Bollinger Band.
If the price touches the upper band, traders may consider selling. If the price touches the lower band, traders may consider buying. Traders may also use other technical indicators like RSI or MACD to confirm their trades.
#7 Elliot Wave And Fibonacci Retracement Strategy
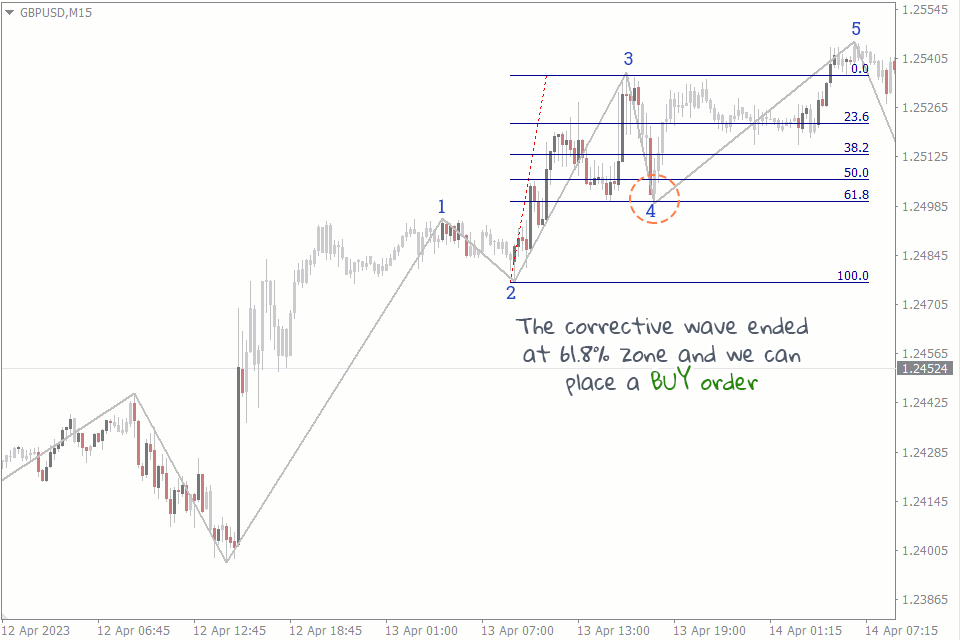
You can combine the Fibonacci retracement tool with the Elliot wave indicator to create a powerful strategy. Here's how it works:
Identify the main trend of the market using the Elliott Wave zigzag indicator. Elliot wave is based on the idea that market prices move in a pattern of five waves in the direction of the main trend, followed by three corrective waves.
You can then use the Fibonacci retracement tool to anticipate the end of the corrective wave (wave 2 or wave 4.) After which, you wait for the price to retrace to one of the Fibonacci levels, which could act as a support or resistance level.
Place a buy or sell order at the Fibonacci level with a stop loss below the previous low (for long trades) or above the previous high (for short trades). You can then set your target profit level at the next wave of the Elliott Wave sequence.
Wrapping Up
Fibonacci tools are powerful technical analysis tools that can help you simplify your analysis and dramatically improve your profitability.
By combining these tools with other technical indicators, such as the EMA, support & resistance levels, Trendlines, and pivot points, you can create various effective trading strategies.
As with any trading strategy, it's important to practice using these strategies in a demo account before risking real money. By doing so, you can gain confidence in your trading decisions and increase your chances of success in the market.