All Fibonacci Tools in Forex: How Do They Work and What Do They Show?
One of the most widely used sets of tools in forex is the Fibonacci one. And the most common Fibonacci tools are Fibonacci retracement, expansion, arcs, time zones, and fan.

In this article, you’ll learn about each Fibonacci tool and how you can use it in your forex trading.
Here are the 5 kinds of Fibonacci tools that are popular among forex traders.
Fibonacci Retracement Tool
The Fibonacci retracement tool is arguably the most popular of all the Fibonacci tools out there. You could trace its popularity to its reliability in predicting potential price retracement levels. These retracement levels are based on the Fibonacci sequence.
In an uptrend, like in the chart above, you draw your Fibo retracement tool from the bottom of the trend to its peak. This line is called a baseline. The bottom becomes your 100 retracement level, while the top is your 0 retracement level. The levels in between these two are, however, the most important.
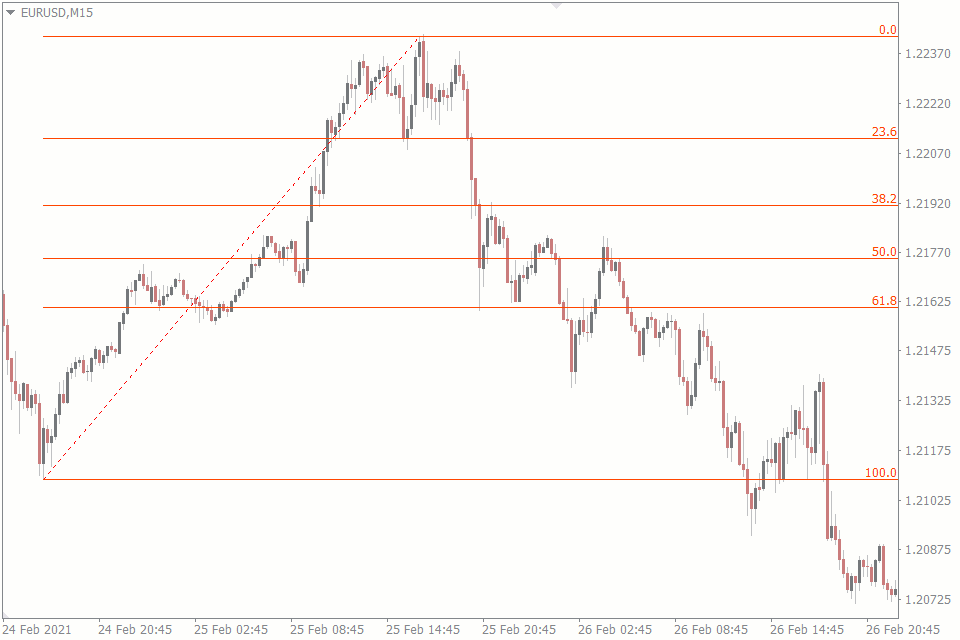
Apart from predicting potential pullback levels, Fibo retracement tools are also useful for determining dynamic support and resistance levels. You may check out our complete guide to the Fibonacci retracement tool to learn how to trade using this tool.
Fibonacci Expansion Tool
The Fibonacci expansion or extension tool, just like other Fibo tools, predicts price levels. However, the expansion tool tells you where price might be headed in the trend's direction. So, if the market is in an uptrend, the Fibo expansion tool predicts the new peak of the price before the price actually gets there. This feature makes it useful in setting profit targets.
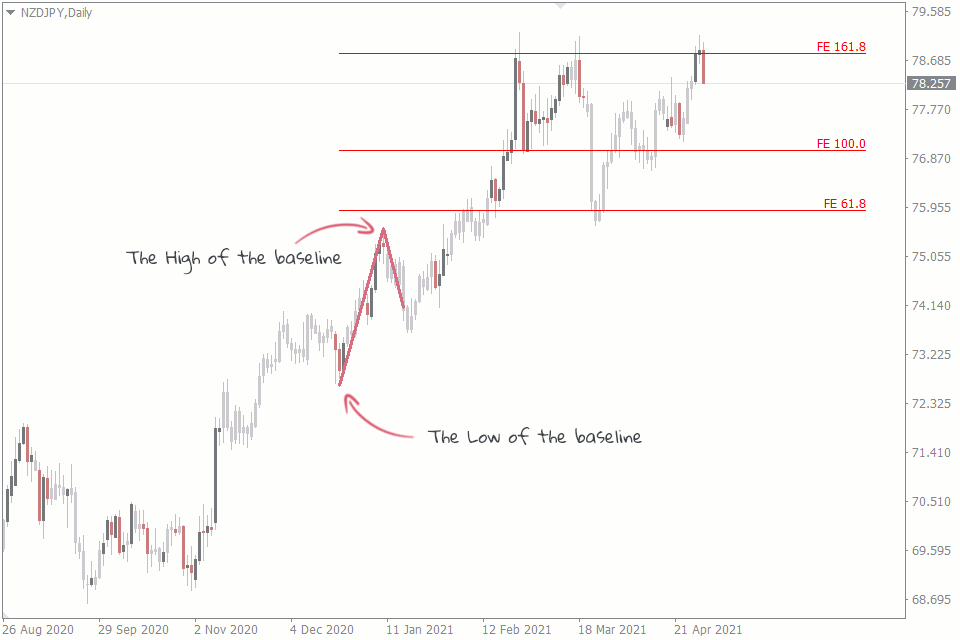
When you use the inbuilt MT4 Fibo expansion tool, it shows you three important levels: 61.8, 100, and 161.8. These levels are your potential price targets. Take the chart above, for example. We draw our expansion tool from a low to a high.
See how the price makes a brief reaction at the 61.8 expansion level but heads towards the 161.8 level. And if the 161.8 level was your take profit level, you would have exited the trade at the best time, because the price has immediately reversed from that level.
Fibonacci Arcs Tool
The Fibonacci arcs tool is a less popular tool but it is in no way inferior to other Fibonacci tools. Fibo arc tool is most commonly used to represent the potential support and resistance levels close to your baseline.
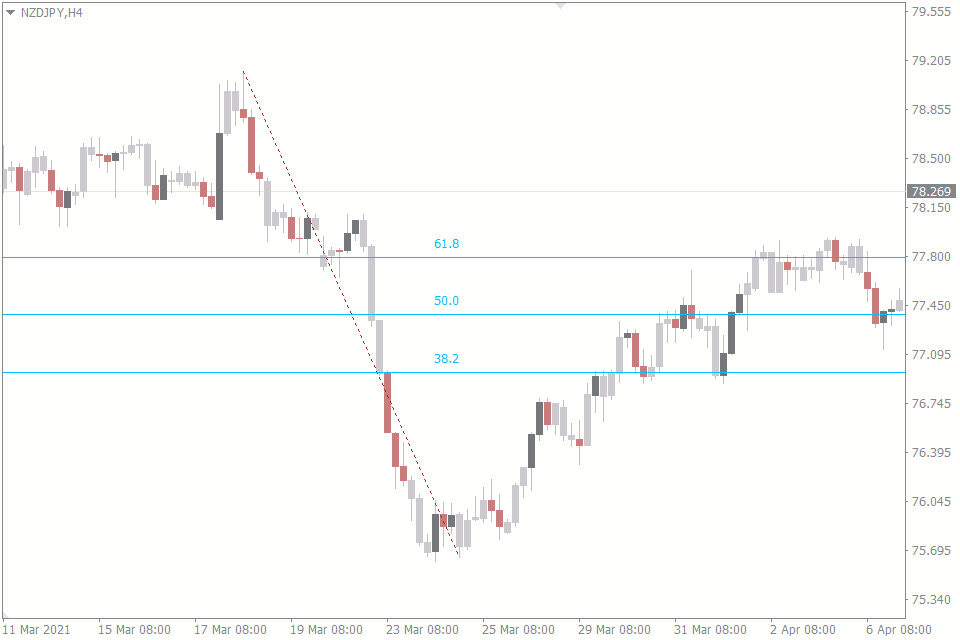
You can draw the Fibo arc from a swing low to a swing high in an uptrend market. That baseline between those two points becomes the radius from which the arc is drawn. The arcs between these points are drawn using the Fibonacci ratios of 38.2%, 50%, and 61.8% on the MT4. In addition, the MT4 uses straight lines to represent the arc instead of using actual arcs.
Another thing about the Fibonacci arcs tool is that it is somewhat similar to the Fibonacci retracement tool. If you draw both the arc and retracement using the same swing high and low, their levels will coincide accordingly. For example, the 61.8% levels of both tools will fall at the same price level.
Fibonacci Time Zones Tool
The Fibo time zones tool has more to do with time than it does with the price levels. In fact, the tool divides the time on the chart using Fibo ratios. And it is useful in determining where the important areas to look out for are likely to be in the future.
You draw the baseline for the Fibo time zones tool in the same way you would draw it for every other Fibo tool: from a swing low to a swing high or in reverse. Some numbered vertical lines extend to the right of the chart, suggesting potentially important areas.
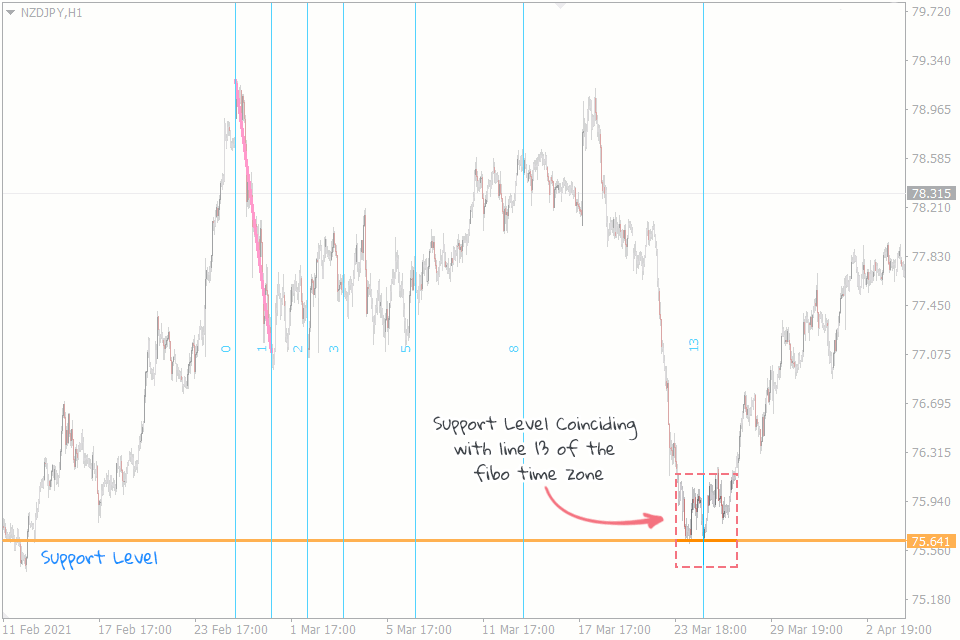
We often ignore the first few lines, as they are generally unreliable. But reliability increases starting from lines 13, 21, 34, 55 and so on, following other Fibonacci numbers. See how the price makes new major moves from the 13th line in the chart above.
Fibo time zones tool comes in handy when you want to make trade confirmations, for instance, i.e. in situations where a resistance level coincides with a time zone line. In the chart above, you can see that there is a major support zone that coincides with line 13.
Fibonacci Fan Tool
The Fibonacci Fan tool relies on the Fibonacci ratios, just like most of the other Fibo tools. The only thing is that the graphical representation of the fan tool is unique.
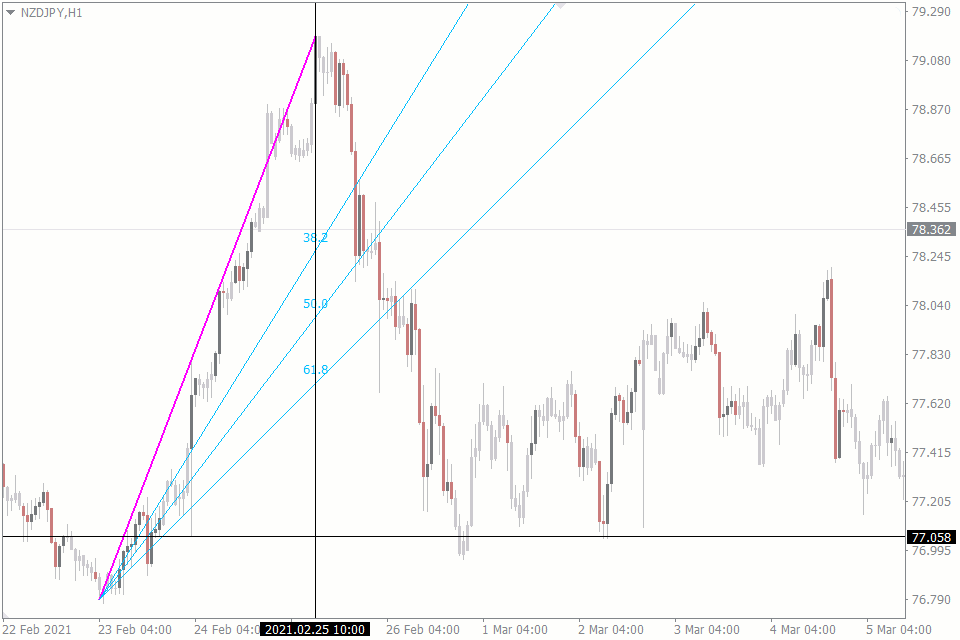
The Fibo fan tool forms its baseline from a swing high or low and ends at the opposite low or high, respectively. But this tool gets its fan-like appearance by drawing an invisible line straight down or up from the second high or low.
It is this line that the Fibonacci ratios divide. Then the line projections are drawn from these division points to the beginning of the baseline. As a result we get something that looks like a fan.
The Fibo fan tool is used similarly to the retracement tool. It also shows where the price retracement is likely to happen – up or down a trend.
Conclusion
These Fibonacci tools are inbuilt into the MT4 trading platform. But you can get access to many more useful MT4 tools and indicators on the FXSSI Product Manager.