The Best Indicator For Support and Resistance
Identifying and drawing support and resistance levels are some of the first few things a novice trader learns in forex technical analysis. And depending on the instructor or trade academy, there are several ways to draw them on your charts.

At first, this might take some getting used to. And for expert forex traders, constantly drawing these levels as they develop can be monotonous and sometimes stressful. But thankfully, some tools help make the identification and drawing of these levels a lot easier for traders of all skill levels.
The Usefulness of Support and Resistance Levels
If you have been trading the forex market for a while, you might have noticed that the prices often move between supports and resistances. And if you look closely, you might also find that the previous support and resistance levels are still relevant in the charts today. This just goes to show how important these levels are in forex.
However, just knowing that prices respect support and resistance levels is not enough to help traders make their trades. Instead, one has to learn how to identify relevant support and resistance levels in forex because not all of them are important. After identifying them, you also need to know how to draw them on your charts.
Of course, you could do this manually, or you could make use of a tool to help you with it instead. This way, you can concentrate on other important aspects of your trading strategy if you’re an advanced forex trader. And if you’re a novice, such a tool could speed up your learning process.
A prominent example of such a tool is the FXSSI Support and Resistance Indicator for the MT4 trading platform.
FXSSI Support and Resistance Indicator
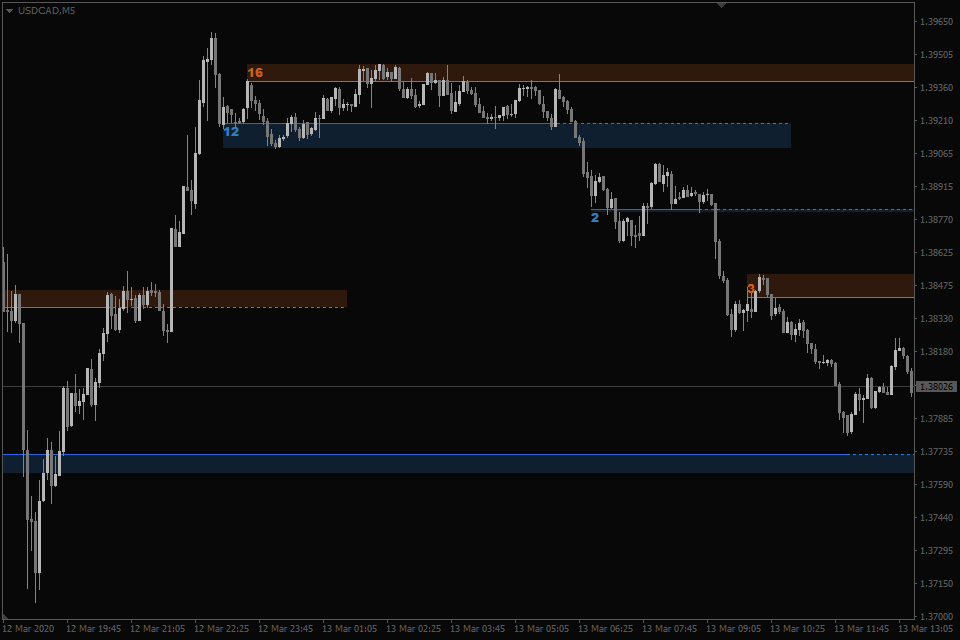
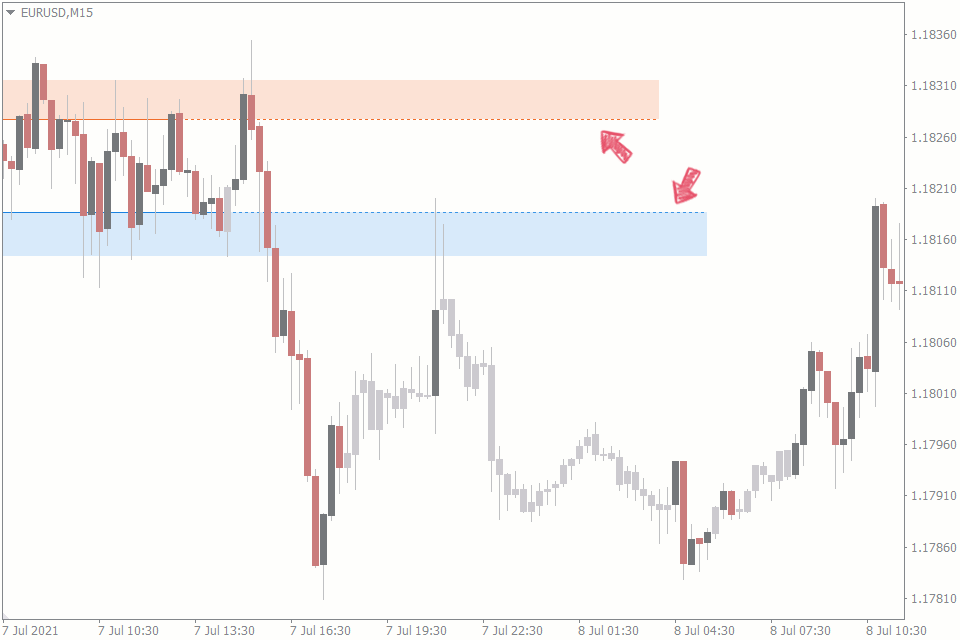
The FXSSI support and resistance indicator automatically identifies relevant support and resistance levels on your forex chart, regardless of the timeframe you’re trading. It makes use of orange lines to depict resistance levels, while blue lines display support levels.
How it Works
The FXSSI support and resistance indicator spots the price levels that have had the most interactions with the market and builds supports and resistances off of them.
The tool relies on the calculations of the Fractal indicator to determine these price levels. Then our indicator isolates those price levels that have the most interactions and draws them.
And since the Fractal indicator works on any timeframe, the FXSSI support and resistance indicator works on any timeframe as well.
Features of the FXSSI Support and Resistance Indicator
If simple drawing of support and resistance levels was all this indicator did, it honestly wouldn’t be worth your time. Instead, it has a handful of enticing features that can help you with your forex technical analysis. Here are a few of the outstanding features of the FXSSI support and resistance indicator:
1. Projection of Support and Resistance Levels
The FXSSI support and resistance indicator doesn’t stop at showing you the recent levels. Instead, it projects these levels into the future with dotted lines and you get to decide the length of this projection. This bonus information gives you an extral edge in making trades, as you can base your take profits and stop losses off of these projections.
2. Determining the Most Relevant Levels
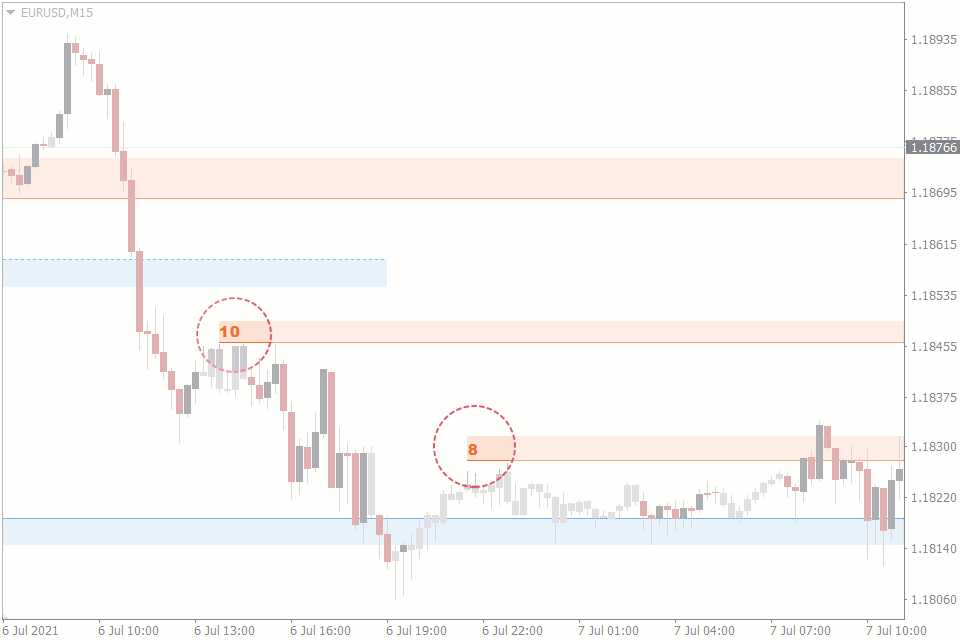
The FXSSI support and resistance indicator also allows you to see the number of interactions a level has had and where these interactions have occurred.
The number of interactions is displayed on the left side of the drawn support or resistance level. Clicking this number shows where the interactions have occurred on your chart. And the higher the number, the more important the level is.
.
Not only can you determine the most relevant support and resistance levels, but you can also monitor the development of these levels. The benefit of this is that you can predict high probability levels, as the price is likely to keep testing such levels until it finally breaks through it.
3. Customizable But Not Overly Sophisticated
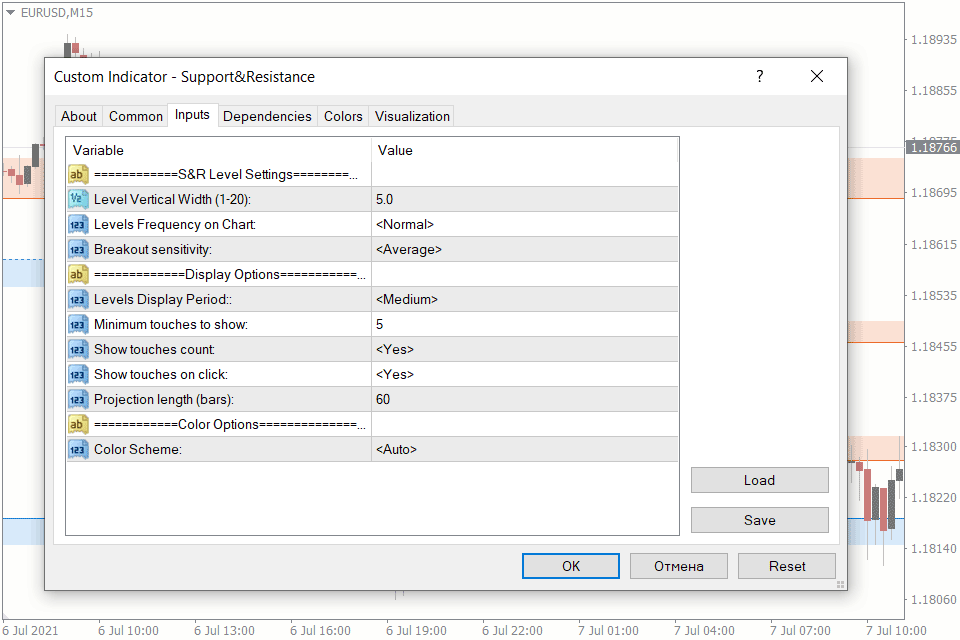
Another interesting feature of the FXSSI support and resistance indicator is that it allows you to customize what you see and adjust the settings to your liking. There are just enough customizable options to make your use of the tool seamless, and you won’t be drowning in unnecessary preferences.
For instance, you can edit the width of the levels to help you catch a wider price range. Or you can reduce the width to make it more sensitive to breakouts. You can also customize the minimum number of touches (or interactions) a level must have before it is displayed on your chart.
How the FXSSI Support and Resistance Indicator Compares With its Alternatives
Most of the other support and resistance indicators out there are limited to drawing the previous levels on your chart. Some go as far as projecting the lines for future trades, but they don’t go much further.
The issue with this is that the indicators aren’t giving you anything new. They are merely displaying the information that you could have found yourself without any extra features.
The FXSSI support and resistance indicator, however, takes it many steps further with its additional useful features. With the feature that tells you the number of touches or interactions a level has had, for instance, you can make judgments about how strong the level is.
Add that to customizable options, and you’ve got yourself the complete support and resistance indicator package.
In addition, you can easily use this tool with the support and resistance trading strategies you know. And the best part is that this indicator is absolutely free to download from the FXSSI products page, where you’ll find even more useful forex trading tools.
Conclusion
With the FXSSI support and resistance indicator you can identify relevant support and resistance levels and build your trading strategies based on them. In addition, useful adjustments and customizations to the indicator can make it easily fit your trading style.

