Support and Resistance Levels: How to Define Them Properly
Support and resistance are some of the fundamental concepts of technical analysis. They allow spotting the most preferred areas for buying and selling.


There is a well-known joke among traders:
Question: How can I make money in the Forex market?
Answer: Buy low, sell high.
Only those who have experience in Forex trading can take the joke, since predicting reversal points on the chart of a currency pair is not as simple as you may think. Technical analysis offers dozens of useful tools to make the task easier. For example, you can spot the right time to make a trade if you know how to find support and resistance levels.
This article is all about how to draw support and resistance correctly. You will learn how to identify support and resistance levels and lines, and get tips on how to use this knowledge in Forex trading efficiently.
What are Support and Resistance Levels?
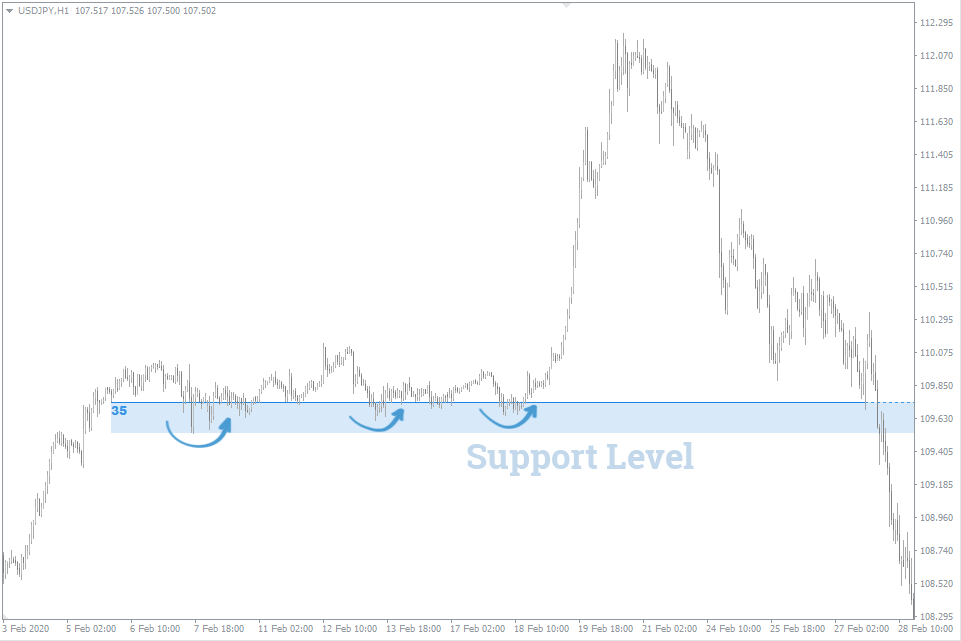
Support level represents such low asset prices at which some market participants no longer want to sell, while others would be willing to buy.
The psychology of market participants is easy to imagine. Sellers start thinking that it is no longer profitable for them to sell a currency pair at current prices. At the same time, there is a growing number of people willing to buy it. Many of them think the currency pair is undervalued and find the idea to buy it at the current low price quite reasonable. As a result, buyers are getting more active than sellers, and the price makes a new low on the chart of the currency pair.
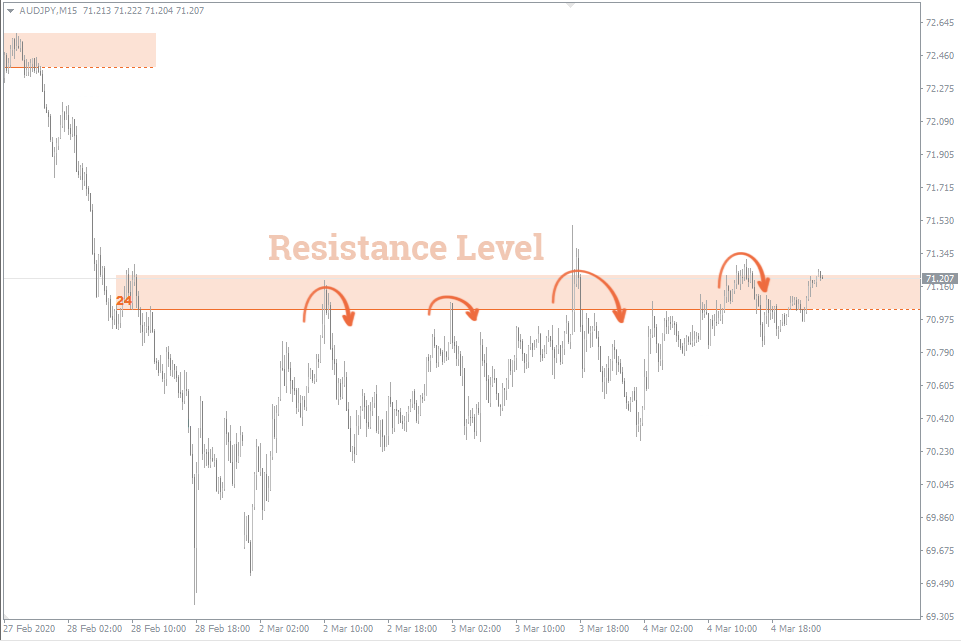
Resistance level represents such high asset prices at which some market participants no longer want to buy, while others would be willing to sell.
Let’s analyze the market psychology as well. Buyers start thinking that buying this currency pair at current prices involves risk. On the contrary, there is a growing desire to sell the financial instrument among sellers. As a result, the pressure of sellers becomes higher than that of buyers. The rise of prices gives way to their fall, which makes another price high on the currency pair chart.
Why Draw Support and Resistance Levels?
Success in the Forex market largely depends on the ability to make the right trading decisions.
Various trading methods and algorithms help with this. Today, there is a large number of them, but not all are efficient. Time-proven strategies using support and resistance levels still show pretty good results.
The idea behind these strategies is to correctly plot the support or resistance levels that may affect the movement of a currency pair. You should do this consistently, starting from the higher timeframes up to the one you’re going to trade.
The next steps depend on the behavior of a currency pair at the given moment:
- Uptrend. After breaking out the resistance, you should open a Buy trade.
- Downtrend. After breaking out the support, you should open a Sell trade.
- Horizontal range. It’s convenient to buy a currency pair in the lower range zone, and sell it in its upper one.
As you can see, the underlying idea is simple and logical. But the hardest thing here is how to actually draw support and resistance levels correctly.
How to Draw Support and Resistance Levels Properly
The following rules will help you to calculate strong support and resistance levels.
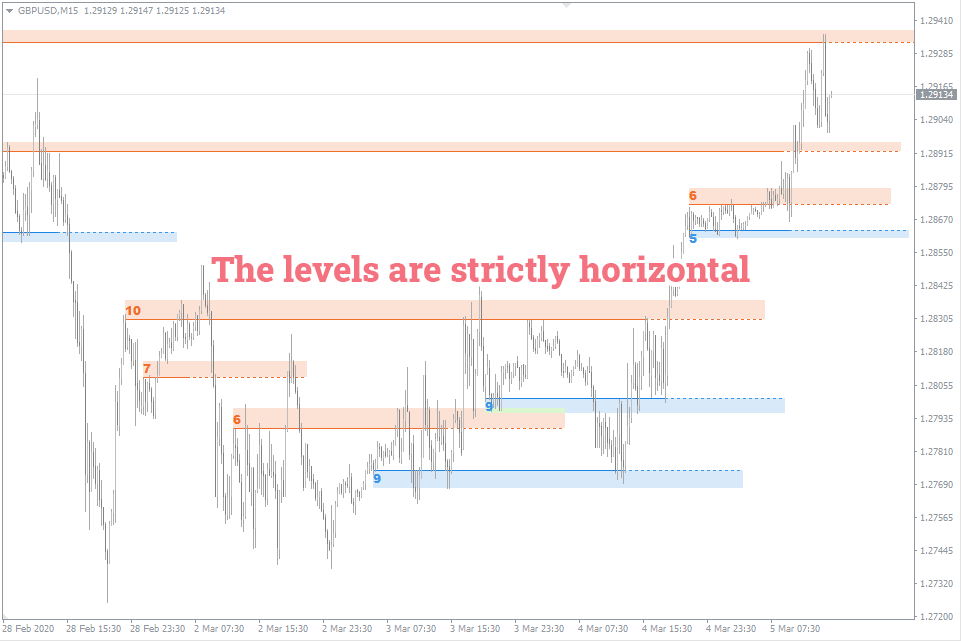
- Support and resistance levels should be in a straight horizontal position.
Don’t confuse them with sloping support and resistance lines. We’ll talk about them later.
- Take higher timeframes into account.
We mean monthly, weekly, and daily timeframes. It is believed that support and resistance levels are more significant on these timeframes.
If you draw support or resistance levels on the H1 chart, the price will most likely take out this level easily on a daily timeframe.
However, if you draw support or resistance levels on the daily timeframe, the price with a higher probability will bounce from this level on the H1 timeframe.
- Plot only the key levels.
Many traders plot on the chart all the support and resistance levels they’re able to find. This approach makes it very difficult to analyze the market since the resulting picture looks like “white noise”.
Keep in mind that your goal is to spot significant levels, which can cause the price to bounce from them and create the potential for buying or selling. That’s all that should matter to you.
Of course, a logical question arises: which levels are considered significant, and which aren’t?
There is a universal solution when it comes to this: if the price fails to break out some level more than once, the level may be considered as a significant one. If a certain level holds the price many times, it will most likely hold the price pressure back in the nearest future.
- Don’t go deep into history.
There is a common mistake in technical analysis, namely, scrolling back through the time scale of the MT4 trading terminal too far. It is typical for traders who want to plot all possible levels on the currency pair chart. But, as we have already said, this is not the best approach.
Even though scrolling a little back through the time scale is recommended, as this allows for a more comprehensive analysis, don’t get too carried away.
It’s believed that scrolling back for about a couple of years is acceptable for the weekly chart, six months is enough for the daily chart, and two months should do for H1 and H4 charts.
- Don’t dwell on the perfect drawing of levels.
It’s customary to plot the levels so that they pass through the edges of shadows, i.e., the low (support level) and the high candlesticks' prices (resistance level).
But every experienced trader knows that it’s almost impossible to draw a level so that all price highs or lows lie in a straight horizontal position.
In fact, the price rarely behaves in such a way that we can see clearly defined levels. More often, support and resistance happen to be blurry.
Very often, there are situations when you need to draw support/resistance levels through a few lows/highs. The level may touch the edges of almost all candlesticks, except for one or two. In some cases, it will inevitably pass through the middle of the shadow or even the body of a candlestick. It is acceptable when drawing support and resistance levels.
Support and Resistance Zones
It’s more appropriate to identify support and resistance zones rather than the levels. “Zone” is the name for the range that the price has actively interacted with before. In most cases, it’s the zones that should be drawn on the chart.
Below is a 4-hour GBP/USD chart. You can see that the price has formed several resistance levels in the upper part of the graph. It’s reasonable to combine them into a single resistance zone. Similarly, you can determine three support levels that should be combined into a single support zone in the lower part of the chart.
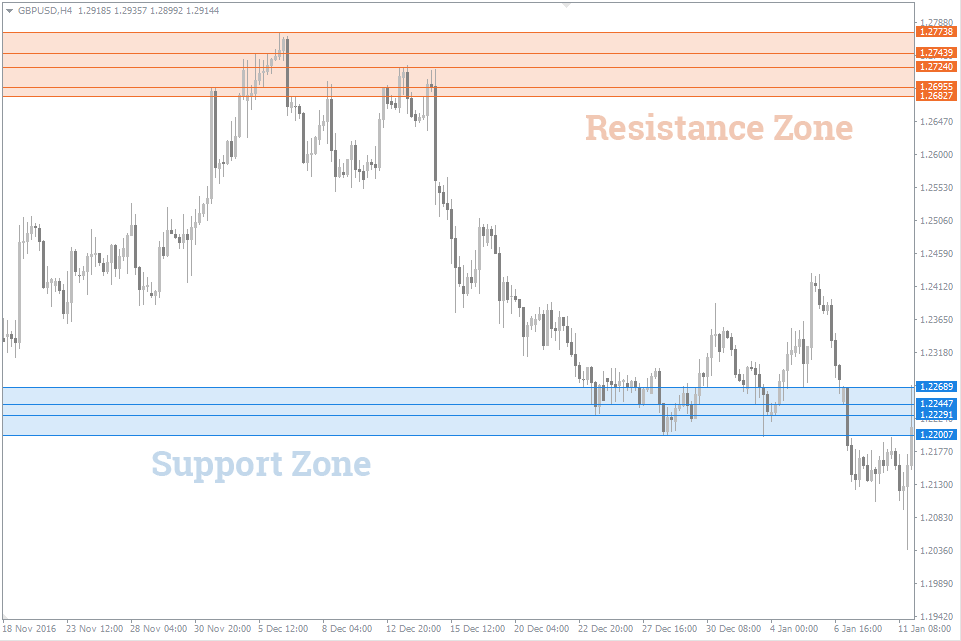
Support and resistance zones better reflect the real market situation. However, many traders believe that “zone” is a very vague concept. That’s why the same question often arises: what’s better to draw – levels or zones? This matter is more of a personal preference. You may well use the levels while meaning the zones.
When Support Becomes Resistance and Vice Versa
You can often see the situation when the price breaks out the level, tests it from the reverse side and bounces from it. As a result, support becomes resistance, and resistance becomes support. They call them mirror-like levels.
Let’s consider the uptrend on the weekly EUR/USD chart as an example:
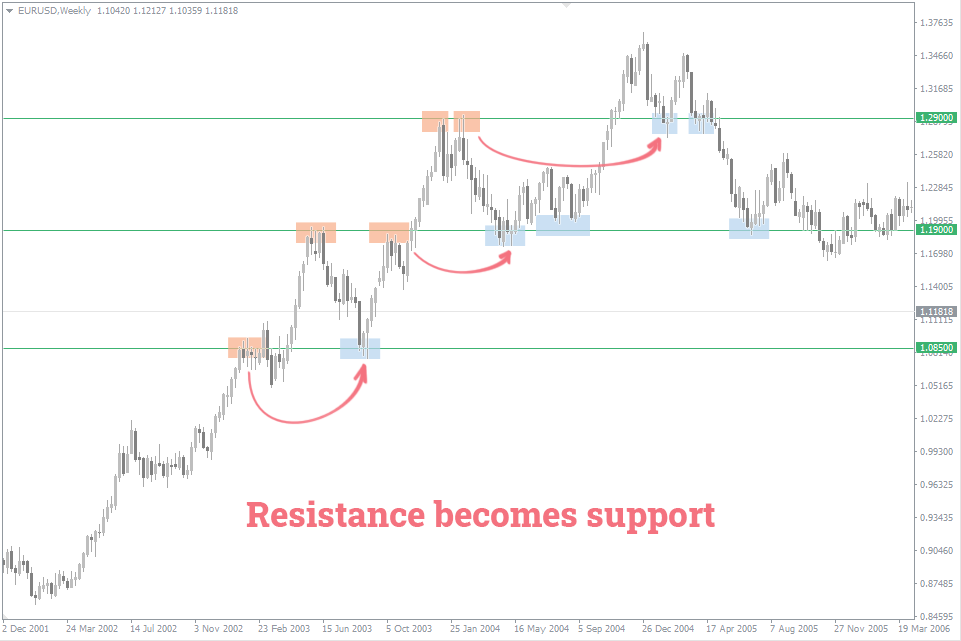
The chart shows that the price is trading near the resistance level at 1.0857 (see the orange horizontal line on the image). Ultimately, the price is breaking out the level and forming a new resistance at 1.1933 (see the red horizontal line on the image). Then it’s heading again towards the 1.0857 level now acting as support.
Having failed to break out the support, the price is rising again, and testing the resistance at 1.1933. After bouncing from the resistance for a while, it does take out this level and makes it a new support.
Then the price forms the third resistance level at 1.2921 (see the blue horizontal line on the image). Having bounced from it twice, it tests the 1.1933 mark a few times. And only afterward, the price breaks out the resistance at 1.2921, which later becomes the new support.
Drawing Support and Resistance Lines
In the previous example, the price is making one high after another, thereby converting the old resistance levels into the support levels. However, while testing the broken out resistance, it has almost reached the level. You can often observe it during a pronounced trend.
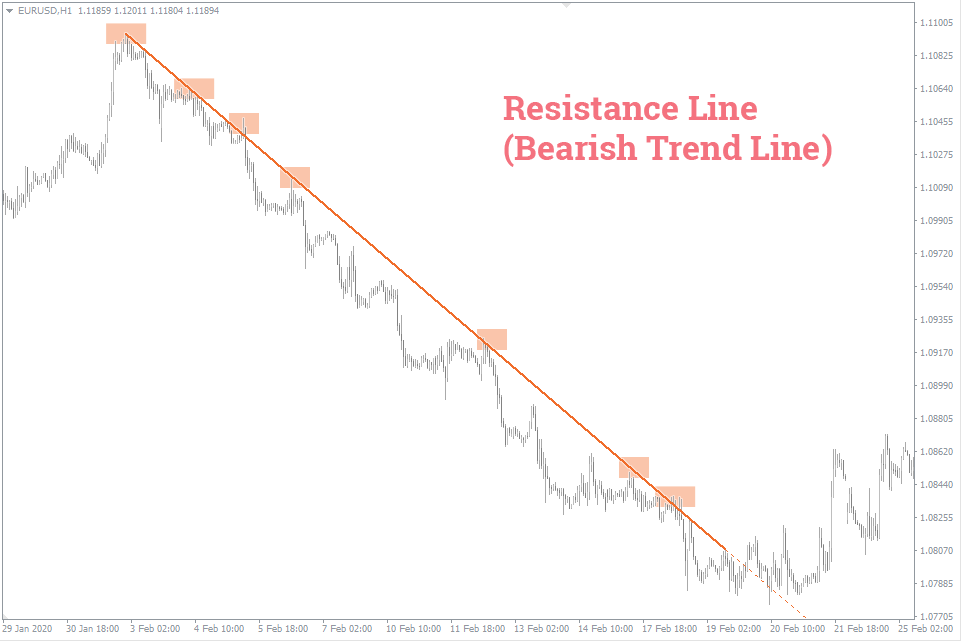
On the weekly EUR/USD chart, each new low is higher than the previous one. If we connect them, we’ll get a so-called support line. It’s the line that the price bounces from during a trend movement. Similarly, you can observe the resistance line during a downtrend.
An important rule of drawing support and resistance lines is as follows: each line must go through at least two price extremes.
If a currency pair shows a steady rise/fall, it’s reasonable to make a Buy/Sell trade without waiting for the price to reach a support/resistance level. In this case, rely on the support/resistance line.
It’s considered that all technical analysis patterns (triangles, flags, pennants, etc.) are just combinations of the support and resistance lines and levels.
How Can I Identify Support and Resistance so That It’s 100% Accurate?
Drawing support and resistance levels is a very important point that you shouldn't ignore. It’s believed that it underlies the entire technical analysis, and it’s impossible to develop an efficient trading strategy without it.
If levels are not accurate, further analysis will be inaccurate as well. Sadly, even professional traders don't always calculate the levels correctly.
This may result in Stop Out or loss of potential profit. Is there any way to protect oneself against it?
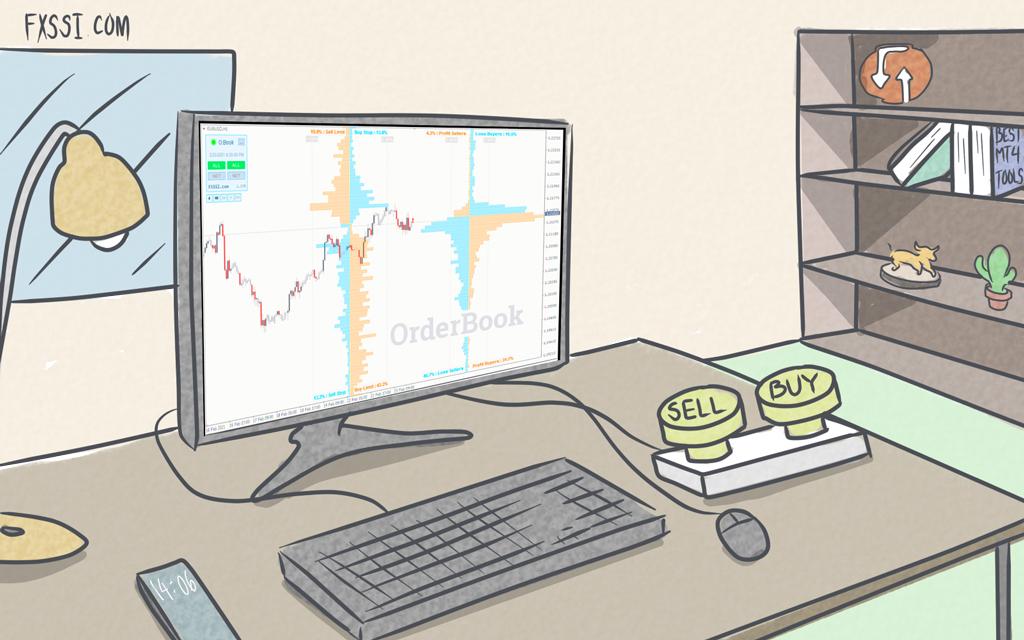
To eliminate the human factor, use the Support&Resistance indicator. It plots both levels and zones of support and resistance.
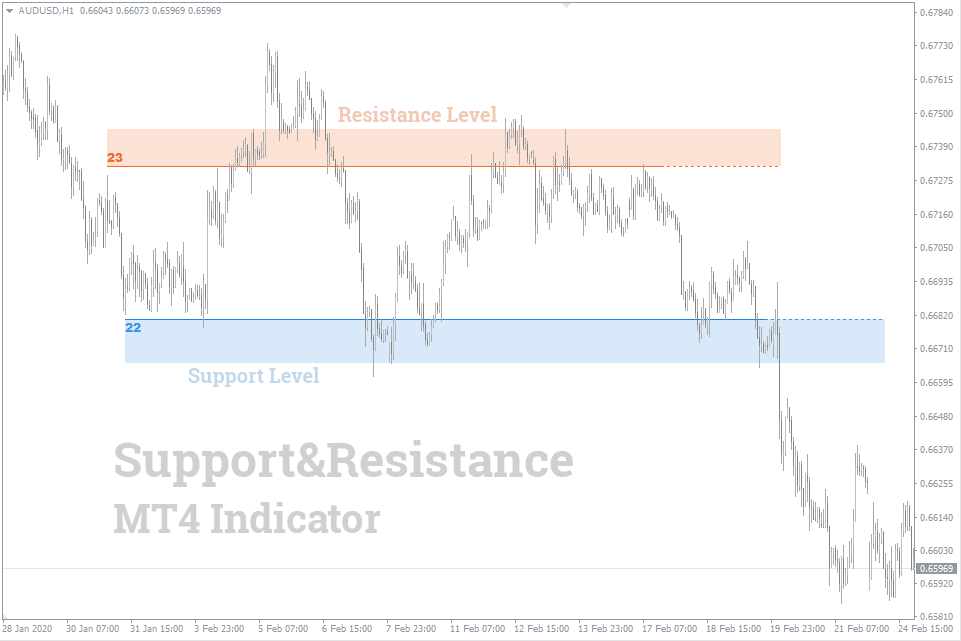
This is probably one of the best indicators of this kind available in the market that ensures the most accurate drawing of support and resistance levels. If you start using it, you’ll significantly increase your chances of making a profit in the Forex market.