Trading Strategies Using Support and Resistance Levels
Support and resistance are some of the basic concepts of the Forex market. Proper drawing of these levels is the key to increasing the number of winning trades.


Nowadays, there are dozens of strategies for trading in the Forex market.
Some of them are considered to be comparatively complicated, so they are mainly used by skillful traders. However, there are relatively simple strategies that are good for newbies and for more sophisticated market participants as well. For example, simple strategies may include trading using support and resistance levels.
In this article, we’ll:
- Consider the most popular trading strategies using support and resistance levels;
- Take a look at real examples illustrating each strategy;
- Give you valuable tips on how to trade using support and resistance strategies.
Before we begin, make sure you have installed the Support&Resistance indicator, since it will be used in all the examples.
Please also note that levels in this article are referred to not as strictly drawn horizontal lines, but as some significant areas that the price interacts with.
Support/Resistance Breakout Strategy
This strategy is one of the most efficient for trading during trend moves. As a rule, the more clearly defined the uptrend or downtrend, the more opportunities for profit.
The "support/resistance breakout" strategy involves the following steps:
- Identifying the price movement direction. If there is an uptrend, we should expect a resistance breakout. If there is a downtrend, we should expect a support breakout.
- As soon as the price makes a real break through the target level, we open a trade: in case of a resistance breakout, we buy a currency pair; in case of a support breakout, we sell it.
- Stop Loss is usually placed above the broken out support and below the broken out resistance. The distance between the level not respected by the price and Stop order should slightly exceed the average volatility of a currency pair.
- We should take the profit as soon as the price shows signs of an incipient retracement. Quite often, the price reverts back to the broken level, which can completely wipe out the potential profit.
Let’s take a look at the examples where this strategy can be applied.
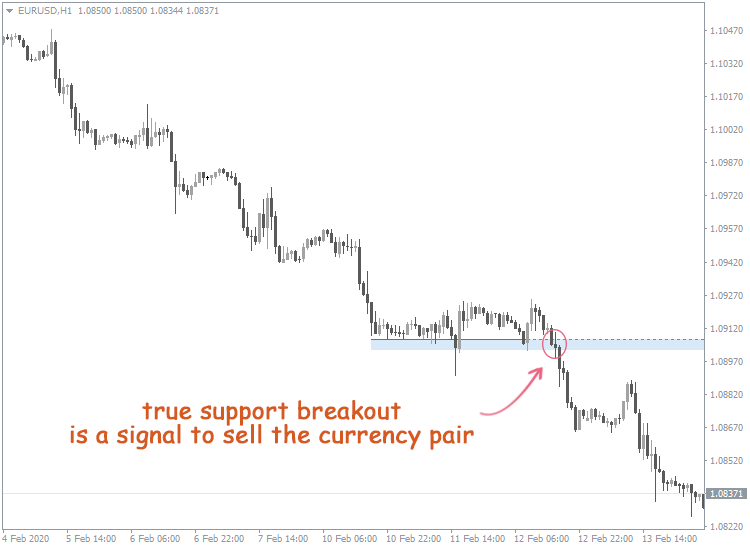
Support Breakout
The EUR/USD currency pair is indicating a downtrend. The image below shows how it breaks the next support level.
As soon as the bearish candlestick closes below the broken level, you can sell.
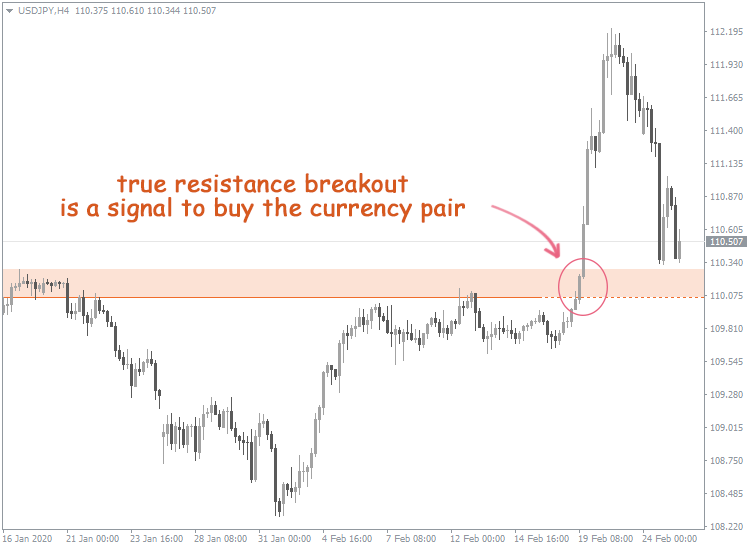
Resistance Breakout
In this example, the price of the USD/JPY currency pair overcomes the resistance level. As soon as the bullish candlestick closes above the resistance zone, it may be regarded as the level breakout. Such a situation is favorable for buying.
The advantage of the "support/resistance breakout" strategy is that it allows you to use strong price movements. Thus, the risk of losing a potential profit is minimal.
On the other hand, there is always a chance of a false breakout. In this case, the price may revert back to the previous trading range and trigger Stop Loss. So before entering a trade, it’s recommended to pay attention to additional signals confirming that the breakout is real.
Placing Stop Loss Properly When Using Support and Resistance Trading Strategies
Once again, take into account that support and resistance levels should be referred to as price zones, which sometimes appear to be quite blurry. The price actively interacts with these areas, so Stop Loss should be placed outside of these zones.
You can set the Trailing Stop instead of the usual Stop Loss. In this case, a trade will be closed automatically as soon as the price starts to retrace.
On the one hand, it relieves you of the need to constantly monitor the market and ensures that you’ll definitely make some profit. On the other hand, there may be a situation when the price enters a non-deep retracement and triggers Trailing Stop. After which the retracement stops almost immediately, and the price heads towards the trend again. The profit made may be much less than the lost one.
These recommendations for placing Stop orders apply to all support and resistance trading strategies.
Support/Resistance Retest Strategy
This strategy also works well for trend movements. The task of a trader is once again to wait for the true breakout of support or resistance level.
The feature of the "support/resistance retest" strategy is that we don't open the trade immediately after the level breakout. Buy or Sell trades should be made only after the price reverses, tests the broken level, and heads in the initial direction again.
Below, you can see the examples illustrating the above mentioned strategy.
Support Retest
The image shows the EUR/USD currency pair price breaking the support level. After a while, it retests the broken level. Then, the price bounces from the level, failing to break it again. Such a situation is favorable for selling.
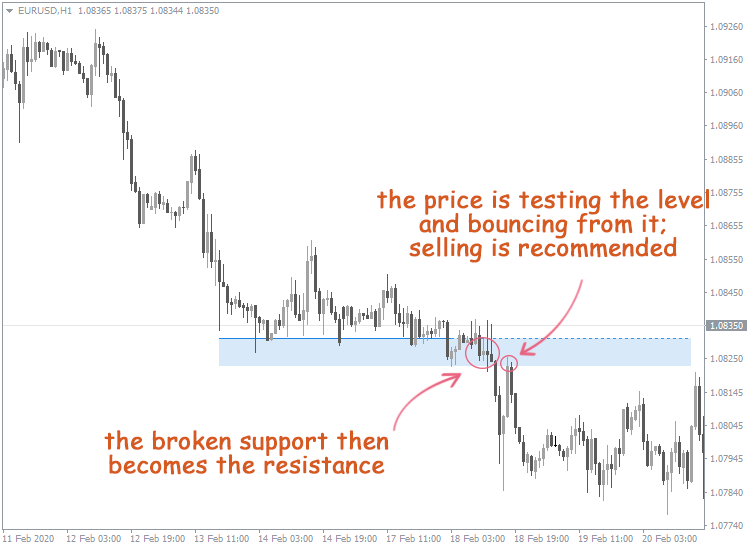
In this case, we can see an example of how resistance turns into support. Such a development can be observed quite often and indicates the significance of the broken level.
Pretty often, the price retests the broken levels two, three or even more times. Each time the price touches a level, it's considered to be a good possibility to enter a trade.
Resistance Retest
Let’s take a look at the example in the image below:
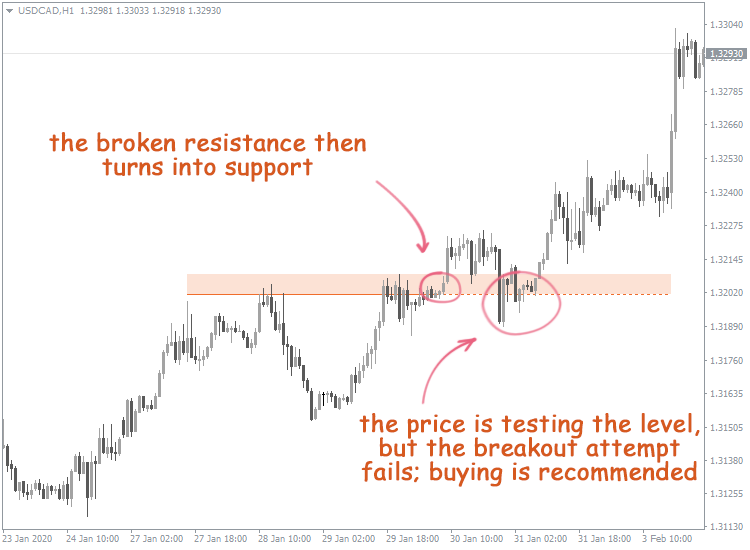
As you can see, the USD/CAD currency pair price indicates an upward movement.
After the resistance level has been broken, the price continues to go higher, but then it enters a retracement stage and retests the broken level. We can see the bounce, after which the resistance becomes the support.
It’s recommended to buy a currency pair if the price has retested the level and left the zone.
Breakout or Retest Strategy: Which One is Better to Trade With?
There is no clear answer to this question. It all depends on the risk level a trader is willing to take.
The “retest” strategy is considered to be less risky. First of all, the false breakout won’t result in losses in this case. Using this strategy, you’ll definitely know that the breakout is real even before you open a trade. Secondly, the “retest” strategy allows you to set a short Stop Loss more frequently, thereby further reducing your risks.
However, the “retest” strategy has its weaknesses. For example, it often leads to the loss of potential profit, since the price doesn't always retest the broken level. So, the opportunity to enter a trade following this strategy can not always be found.
This is typical for strong trend movements: breakouts are powerful, and the price rapidly moves towards the trend.
Of course, retracements also may take place during strong trends. However, they’re not deep, and the price rarely reverts back to the broken levels.
Bounce From Support and Resistance Within the Horizontal Range Strategy
This strategy works well when trading within horizontal price ranges.
Such ranges form when the price is traded between two levels, one of which serves as support, and the other one as resistance. Repeatedly bouncing from one to another, the price can stay in the range for a relatively long time.
It's reasonable to assume that soon enough, touching the upper border of the range will be a good reason for selling the currency pair, and touching the lower one will be favorable for buying.
Let’s take the trading range formed by the AUD/USD currency pair as an example.
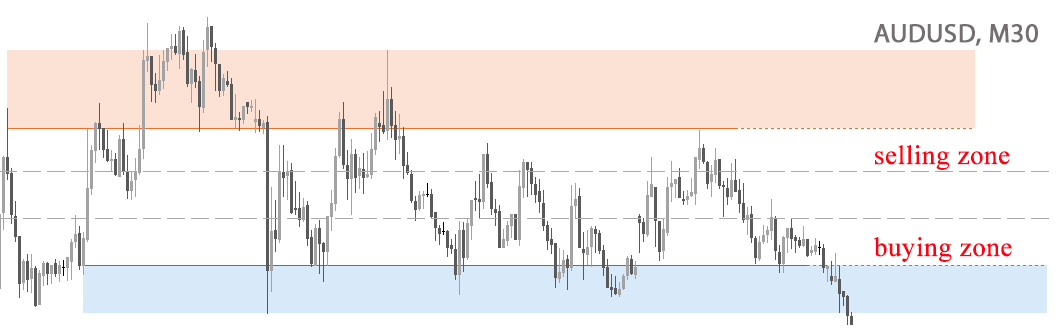
As you can see, the price is moving in a limited range.
As long as the price stays in the support or the resistance area, opening a trade is not recommended. This is due to the risk that the price may break through the level and continue its movement beyond the horizontal range.
For this reason, it is better to make trades only when the price bounces from support or resistance levels.
As a part of this strategy, the zone between support and resistance levels is divided into 3-4 price areas. Their number depends on the range height and features of the chart. In this example, the trading range is divided into three areas:
- Buying is recommended in the zone closest to the support level, and selling is suggested to be in the area closest to the resistance level.
- While the price stays in the middle area, making trades is not recommended.
- Stop orders should be placed outside the boundaries of the trading range, namely, above support and below resistance levels. As with the examples above, the distance from Stop Loss to the corresponding level should slightly exceed the average volatility of a currency pair.
Don’t consider range borders as something permanent. Over time, the price may start to move slightly beyond the range, subsequently returning. The opposite situation is also a possibility – when the price stops reaching support or resistance areas.
Therefore, you need to adjust the trading range from time to time.
The More Touches – the Weaker the Level
Traders often fall victim to the common misconception: the more often the price tests a level, the stronger it becomes. However, the experience of many market participants shows that this isn’t true.
Undoubtedly, if the price often tests the same level, one might call it a significant one. However, this doesn’t necessarily mean that the level will hold the price from going up or down forever.
Let’s address the issue from the point of view of the market participants’ psychology.
Suppose we are talking about the support. If the price regularly attempts to break through this level, this implies a growing pressure of sellers who will sooner or later prevail.
In some cases, support can hold back the price for a relatively long time, and there is an explanation for this.
The sellers (major players) benefit from keeping the asset price high until the orders are fully executed. Therefore, they hold the price from falling, thereby forming the support.
But in the end, all orders will be fulfilled, and powerful market participants will step aside. The price will start falling, and the support will be broken.
A similar explanation applies to resistance.
We can draw an important conclusion here: support and resistance are meaningful price benchmarks that help to determine the right moment to enter a trade. Therefore, trading strategies using support and resistance levels are quite efficient.
However, sooner or later, the price overcomes almost any level. Contrary to popular belief, every breakout attempt makes support or resistance level weaker.
Therefore, you should use support and resistance only as temporary guidelines. And in any case, do not ignore placing Stop orders, relying on the strength of the level.