“Triangle” Pattern: Forex Trading Strategy
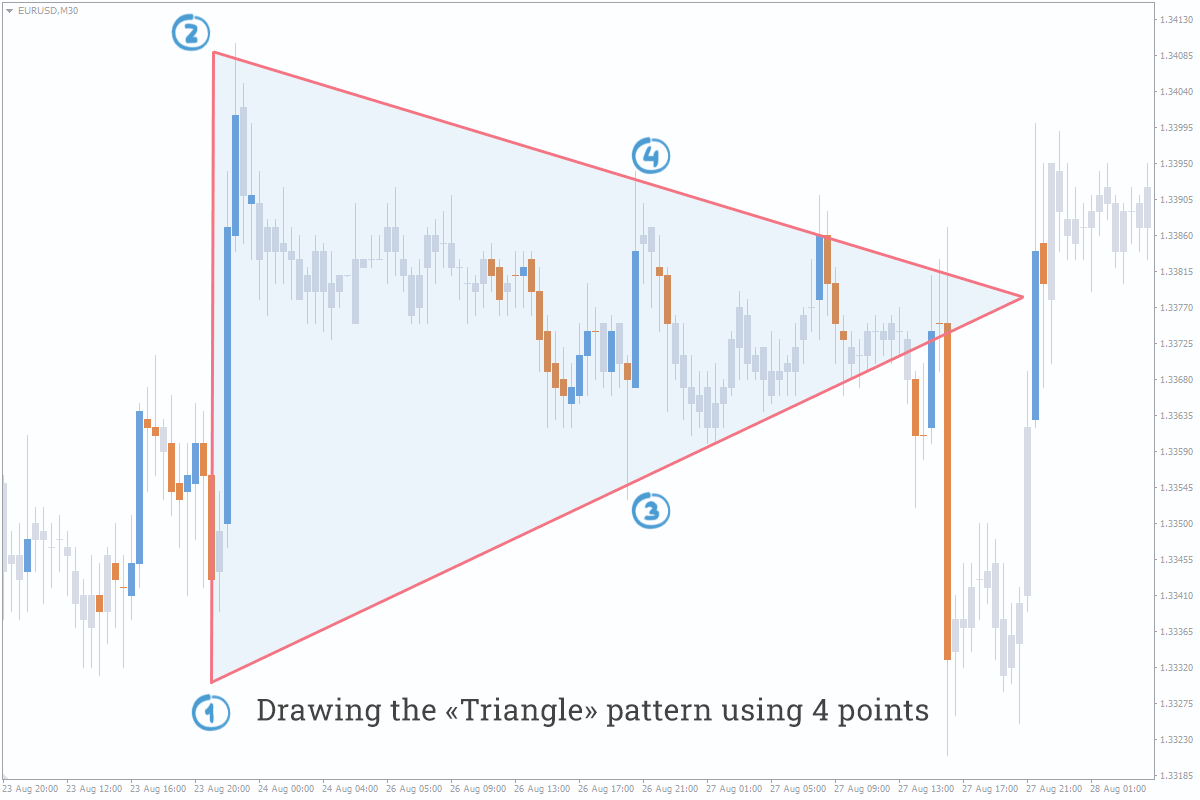
The “Triangle” pattern is a simple technical analysis tool in Forex which is a series of falling tops and rising bottoms (4 points are required to draw the pattern).


Simply put, it represents two lines crossing each other and thereby forming a triangle.
The main difference between the “Triangle” and other patterns is that it might materialize both upwards and downwards depending on which side the price is going to break out.
Classical Trading Strategy
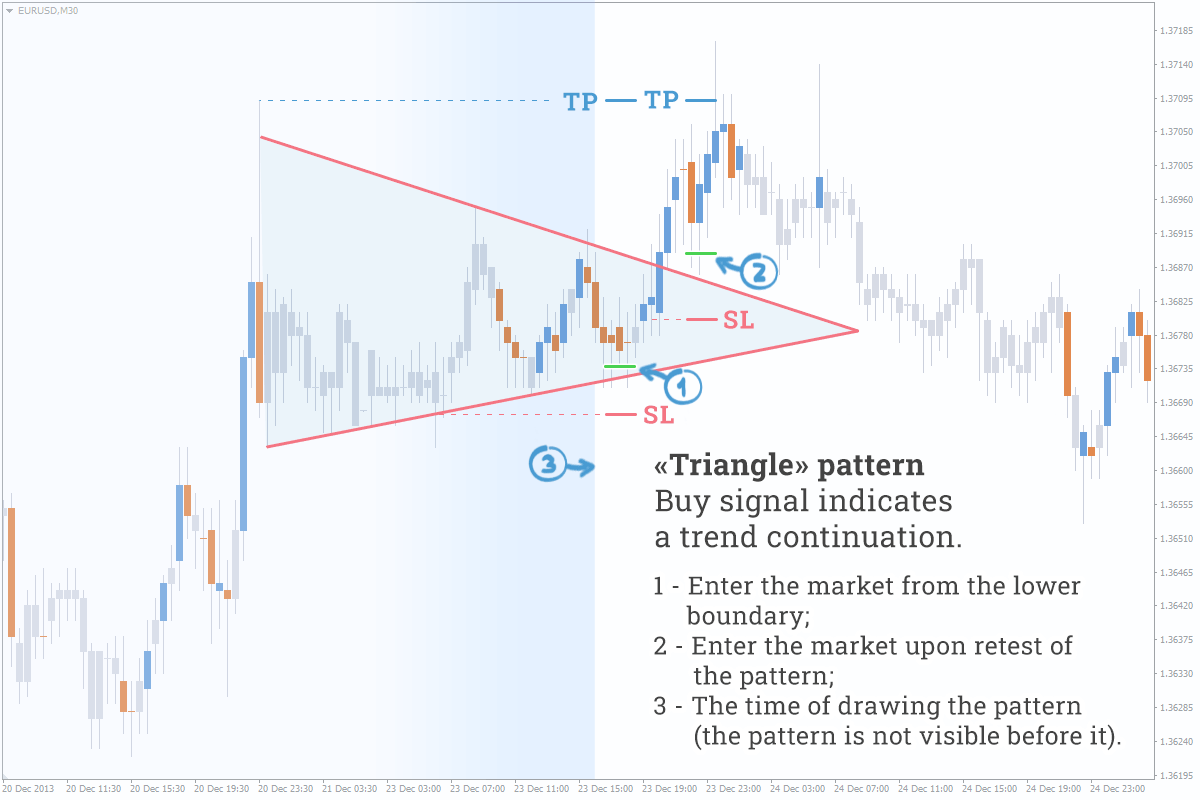
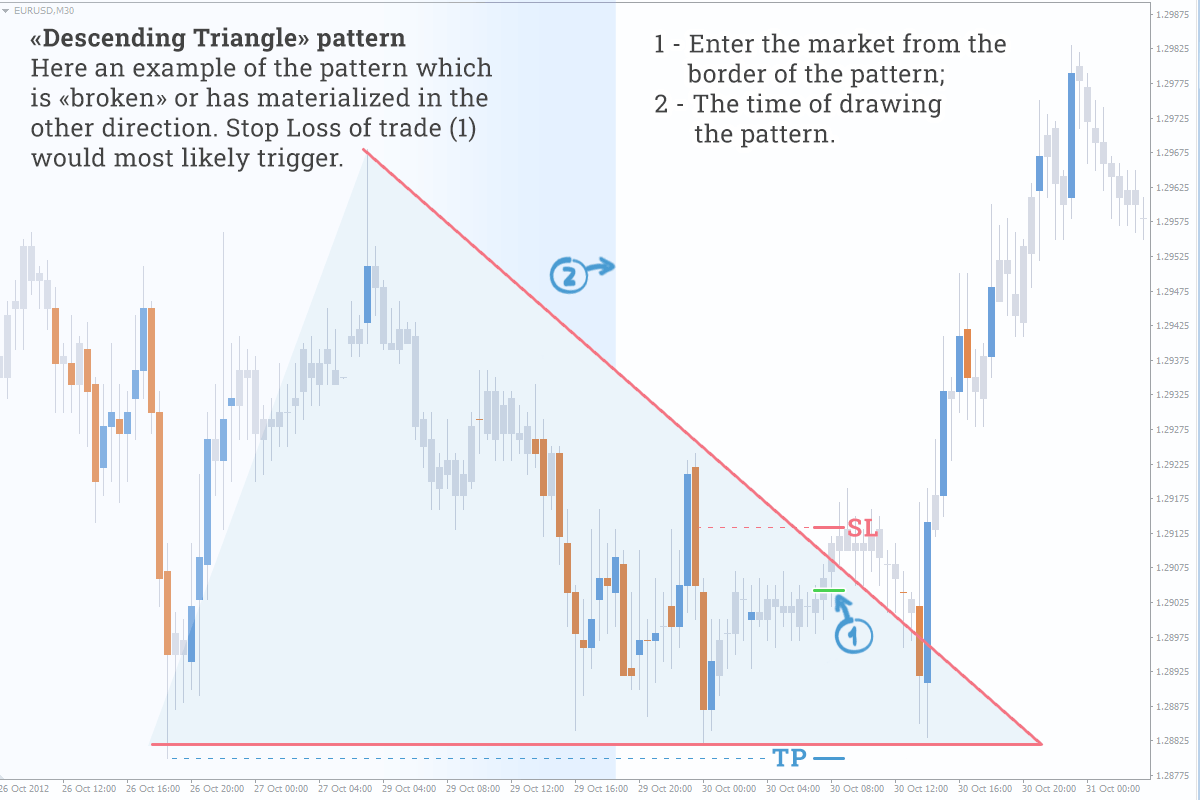
After drawing the pattern, we should wait until the price breaks out one of the pattern’s boundaries and only then enter the market towards this breakout. Learn more details in the picture:
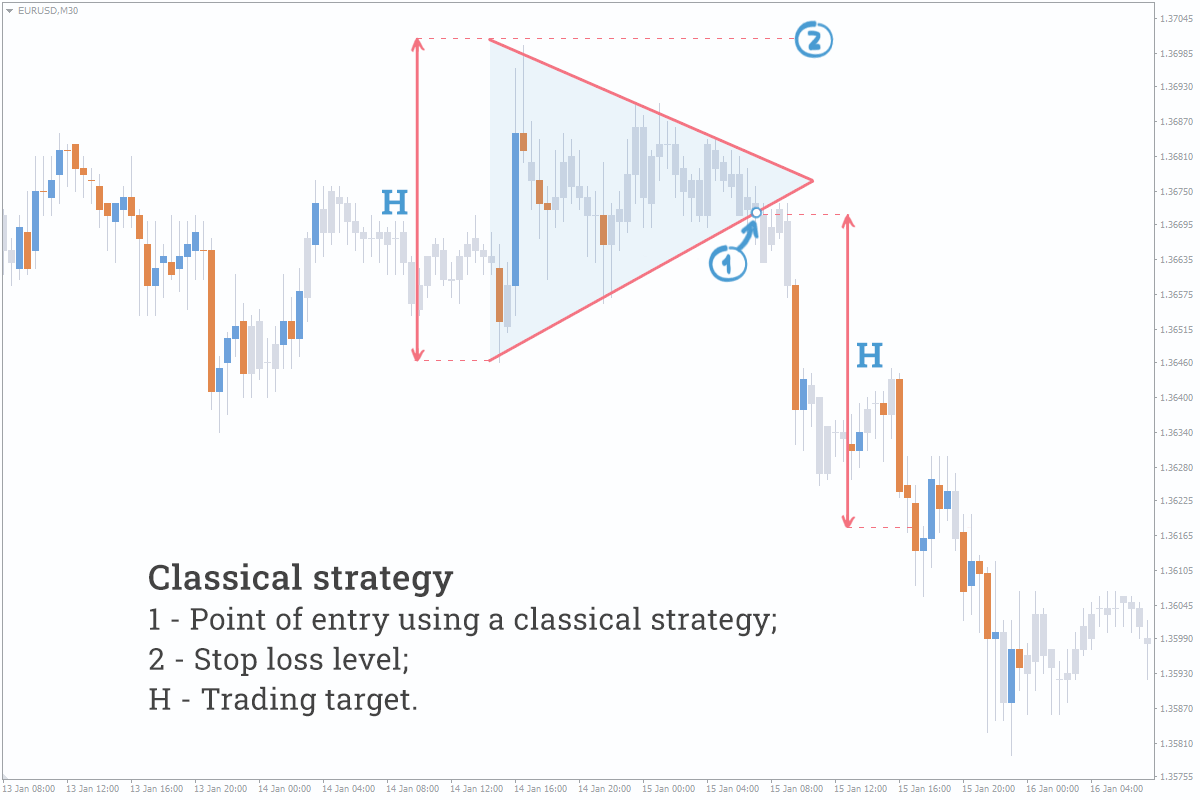
Enter the market at the point (1), when the price breaks out one of the pattern’s boundaries.
Trading target is equal to the height of the “Triangle” pattern’s bottom (H).
Set Stop order at the level of the pattern’s top (2).
Reasons for the “Triangle” Pattern Formation
The formation of the “Triangle” pattern is preceded by an impulse, which temporarily decreases volatility and thus results in the narrowing of the range followed by a gradual buildup of liquidity. Then the market takes a pause and waits it out until participants get involved in trading. Does it sound difficult? Let's try to figure it out using an example:
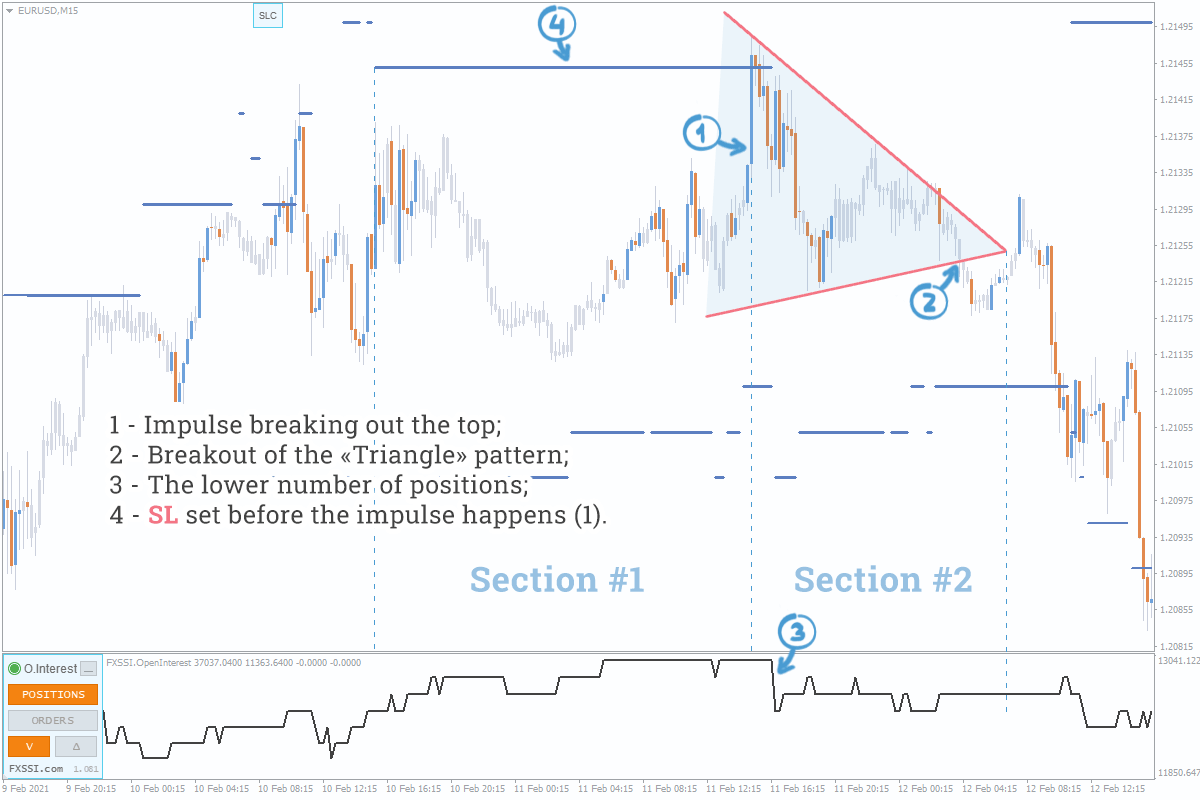
Let’s divide the market into sections from a “higher high” to a “higher high”. The price hits neither Stop Losses nor Take Profits of most traders in the narrow range of the Section #1 that results in adding to positions (see the cumulative delta). Next occurs the impulse (1) breaking out the top that is followed by triggering orders at the level of their cluster. As a result, a large number of trades are closed (2), thereby decreasing liquidity. Afterwards, the cycle repeats itself – we can see narrowing of the price range and formation of the “Triangle” pattern in the Section #2. Orders and positions are again added to until the pattern is broken out next time– see the point (3).
Who does form the straight lines of the “Triangle” pattern? The answer is intraday traders, scalpers, and other small participants who use technical analysis. Big money is more involved in the impulse initiation, and the “Triangle” serves as a good opportunity for them to add to a position.
Alternative Strategies for the "Triangle" Pattern
The "Triangle" is a simple pattern, so it is often found on the chart. M15-D1 timeframes are suitable for searching this formation. We believe that M30 is best suited for finding short-term daily patterns and H4 for the long-term ones. We remind you that it’s better not to trade with Forex patterns in pure state, but to have a basic signal.
Alternative strategies:
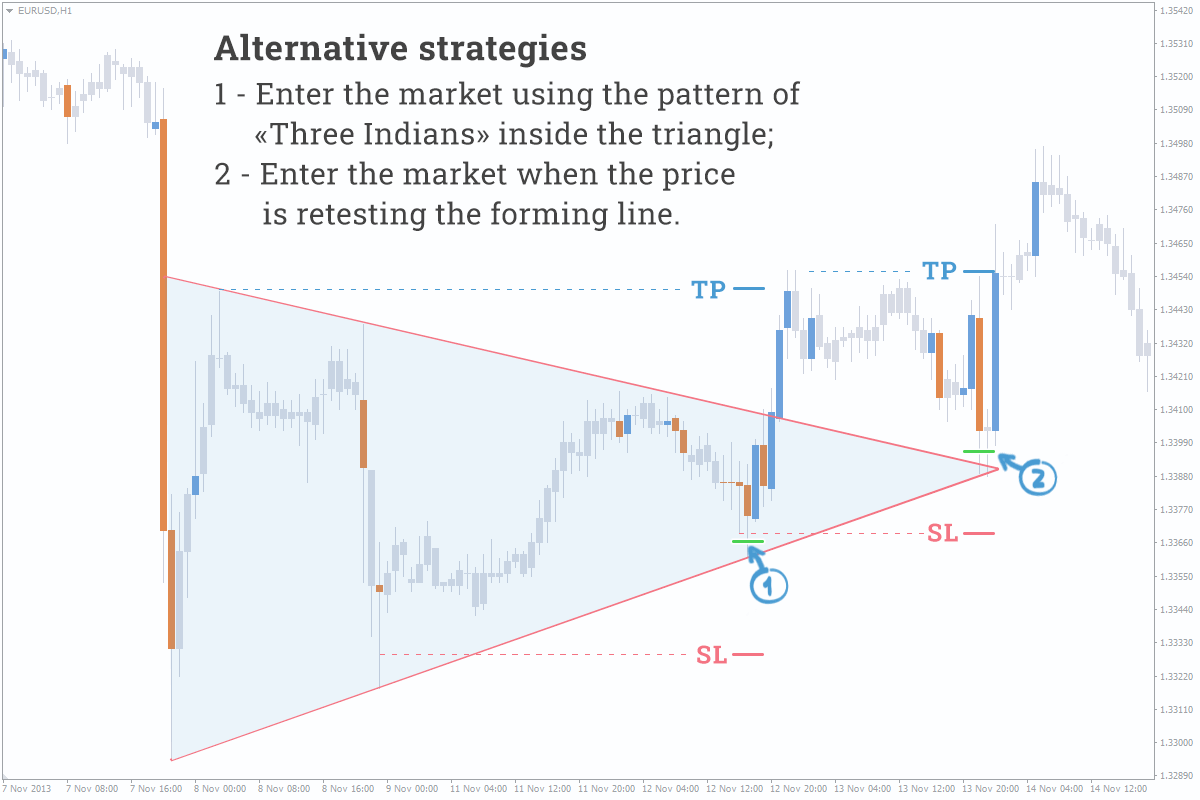
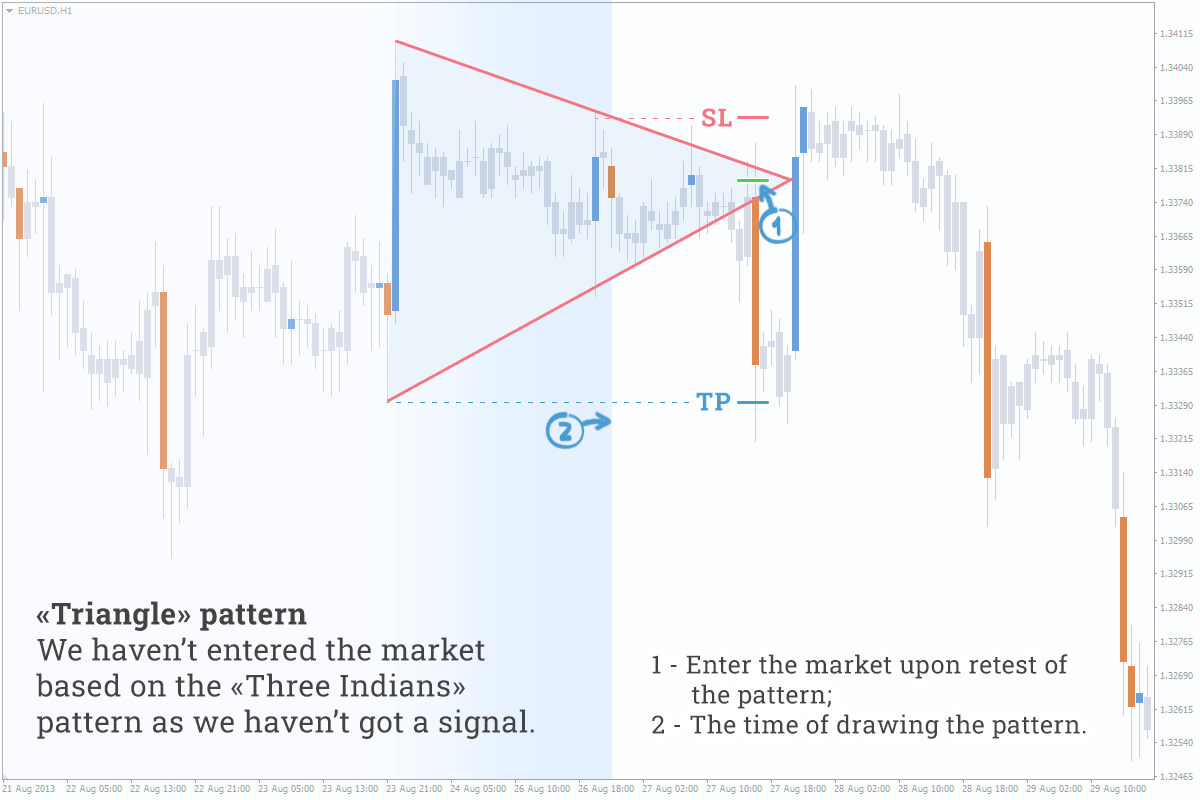
- The strategy is based on the “Three Indians” pattern. The well-known “Three Indians” pattern often occurs inside the “Triangle” pattern.
Enter the market (1) at the point where the price touches the pattern’s border for the third time;
Set a trading target (Take Profit) at the level where the price makes a new high of the pattern’s bottom. See the picture on the right side:
Set Stop order (Stop Loss) several points above the level passing through the point where the price touches the pattern’s border. - Retest of the forming line. We make a trade when the price has pulled back to the line forming the pattern. However, the possibility of such an entry doesn’t always happen.
Enter the market (2), when the price retests the pattern’s boundary;
Trading target and Stop order are similar to the previous option.
We don’t recommend entering the market using a classical strategy during breakout, since it’s very hard to seize the moment of breakout – its duration often doesn’t exceed a minute and there may be slippage.
It’s nice to have high volume spots where the pattern is broken out (it’s due to the triggered orders of the market participants) and when the price is pulling back to the line forming the pattern. The rest of the volumes have quite a bit to say about further materialization of the pattern while it’s being drawn.
Pattern Types
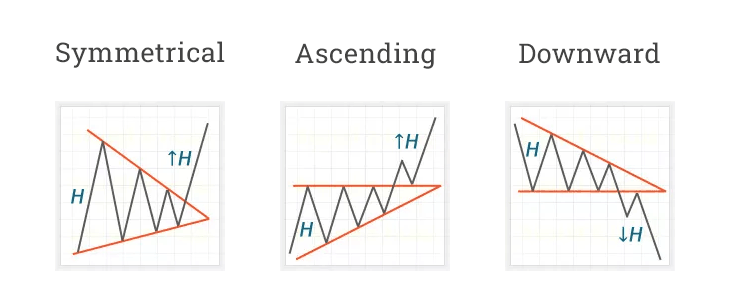
Symmetrical triangle – the probability of breakout in both directions is the same. This pattern should be traded with as described above.
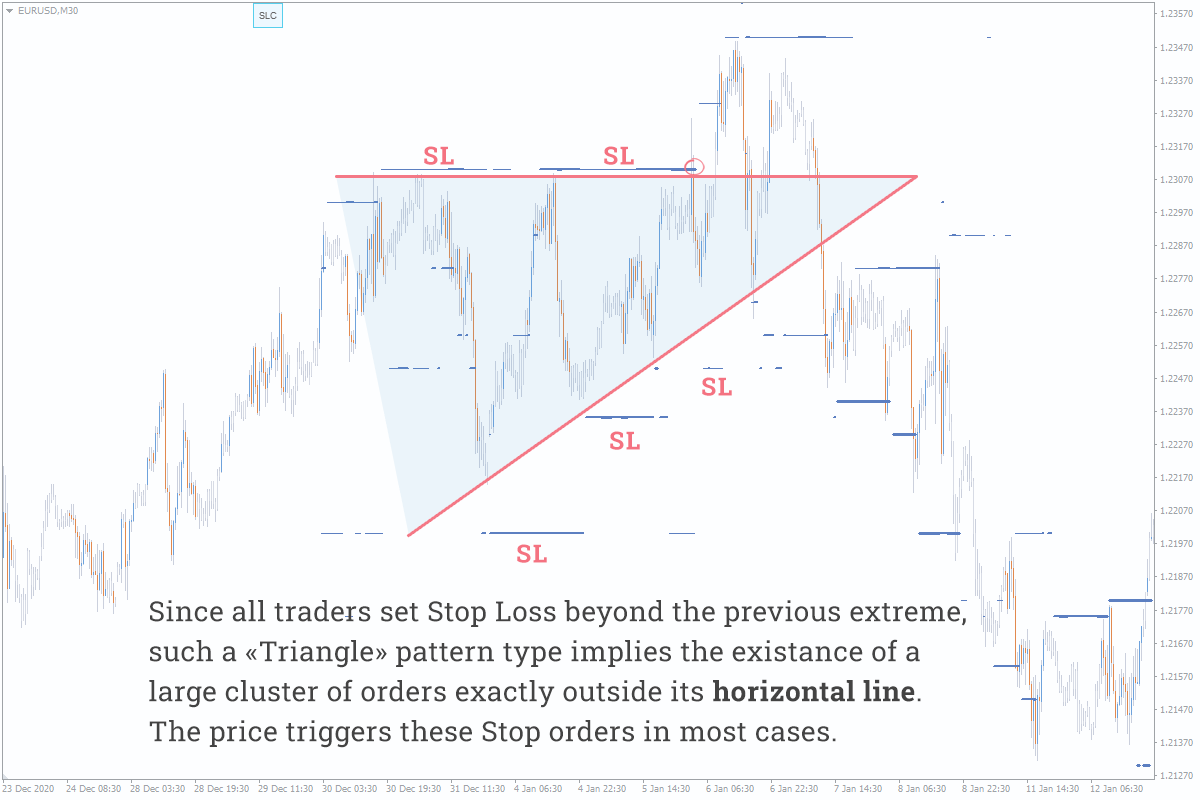
Ascending triangle and descending triangle have a forming line which is the horizontal one. At that, in most cases it’s the horizontal line which is broken out. Why?
If the lines of the “Triangle” are facing in the same direction (up or down), it is a – “Wedge” pattern.
Examples of Trading With the “Triangle” Pattern in Forex


Other patterns in our blog: