Should You Ignore Weekly And Monthly Timeframes At All?
Weekly and Monthly timeframes are some of the most ignored timeframes by many forex traders. But should you join them?

Many traders are day traders. They rarely see the need to use weekly and monthly timeframes in their analysis. Even some swing traders who hold trades longer than day traders sometimes ignore the weekly and monthly charts. But should they?
Should any forex trader ignore weekly and monthly timeframes in their chart analysis?
The simple answer is never to ignore the weekly and monthly timeframes, regardless of your other preferred timeframes. There are essential pieces of information you can only glean from these high-time frame charts.
But it isn’t enough to tell you not to ignore these charts in your trading. Are there reasons for this?
Why You Should Not Ignore The Weekly And Monthly Timeframes
Here are some sound reasons to not ignore the weekly and monthly timeframes in your trading:
The Long-Term Game
As a forex trader, it is not enough to invest so much in the present that you forget to prepare for the future. Having foresight would help you adjust your trading plan for the long-term game. And the only way you can observe the long-term game of a forex market is through the larger timeframes, such as the weekly and the monthly.
But what exactly do we mean by the long-term game?
The weekly and monthly charts show major trends, supports and resistances. And even when the gaps between the price and a major price action level look small on these timeframes, they are often way bigger on the lower timeframes.
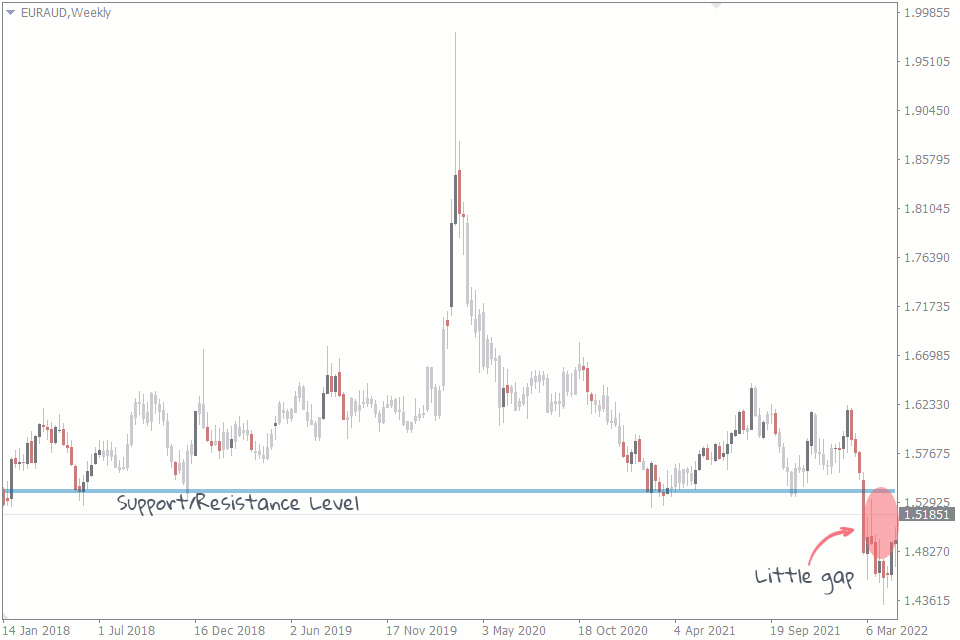
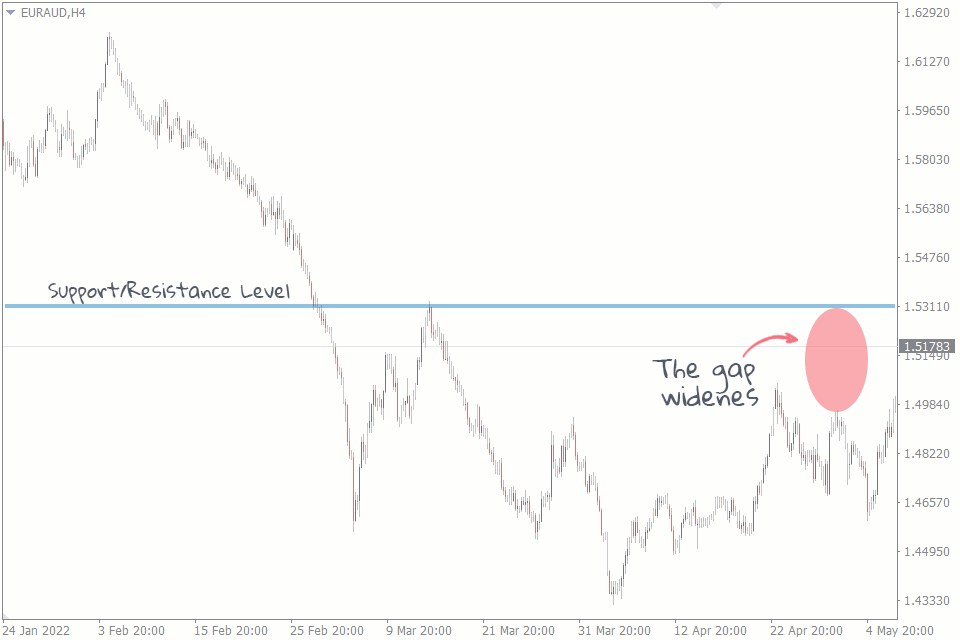
Suppose you’re a day trader, and the highest timeframe you trade is the 4-hour. A small gap between the price and the resistance level on the weekly chart above, for instance, will be a massive space on your 4-hour chart below.
The Full Picture
Sometimes, the smaller timeframes don’t show us the complete picture of what the market is doing. A perfect example is shown in the chart below.
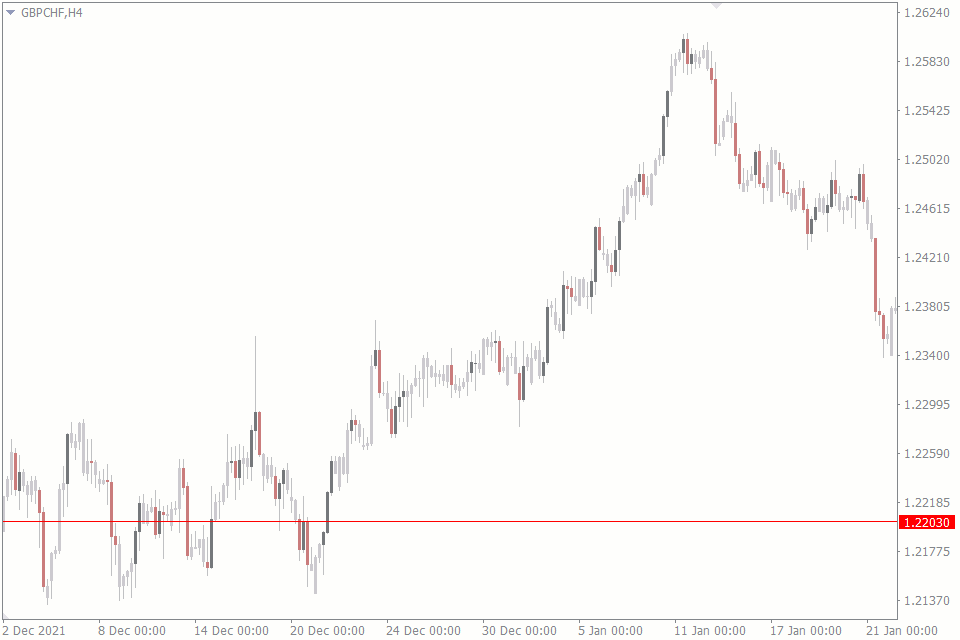
In that chart, the GBPCHF pair in the 4-hour chart looks like it is on an uptrend. After all, it is forming higher highs and higher lows. The next thing most forex traders would do is to wait for the next pullback so that they can ride the trend.
While that is not a bad trade idea, a quick glance at the weekly timeframe reveals that the market is not on an uptrend. In fact, the GBPCHF is on a downtrend, and what looked like an uptrend on the 4-hour chart is only a pullback on the weekly chart. And you know what they say about not trading against the trend.
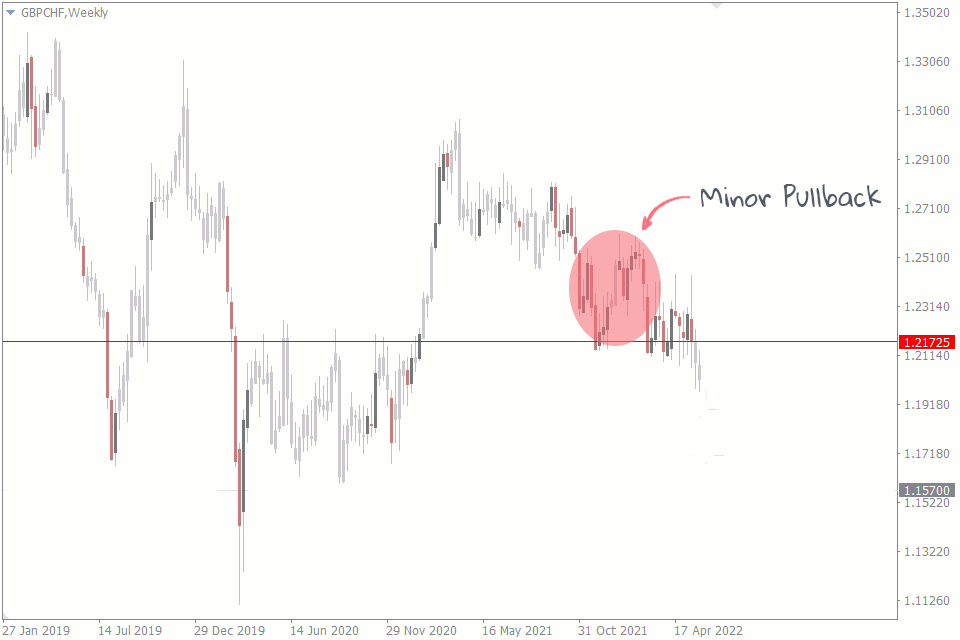
Without the weekly and monthly timeframes, it may be hard to see what the market is trying to do, causing you to think an uptrend is a downtrend.
However, this is not to say you can’t make uptrend trades on smaller timeframes when the larger time frames are downtrend or vice versa. This is where your experience as a forex trader kicks in to help you make the best decision.
Do you trade the hourly uptrend with minimal risks? Have you found that you don’t do well trading against the trend? Or are you going all out like there’s no weekly downtrend on the chart because you know how to manage trades masterfully?
All these questions are what you’ll need to find answers to when trading in such situations.
Multi-Timeframe Analysis
A multi-timeframe analysis is when you use various timeframes to inform your trading decisions. It is looking at different time frames to analyze and confirm your trade ideas.
Here’s an example of multi-timeframe analysis in action:
Assume you see a hammer candlestick right on a support level. This looks like an excellent setup for a buy. You buy at the most recent price, take your profits at the next resistance level and place your stop loss a little below the support level. Simple enough, right?
But as soon as you take the trade, you realize the market flips and breaks the support level, leading to a loss for you. What went wrong?
What you didn’t realize was that on the weekly chart, that candlestick that you thought was a bullish signal was actually a part of the many candlesticks that made up one candlestick that signifies a bearish pattern on the weekly timeframe.
If you had done a multi-timeframe analysis by checking what your smaller timeframe decisions look like on the larger timeframes, maybe you would have made a better decision.
Following The Smart Money
Another reason to never ignore the weekly and monthly timeframes in your trades is that the smart monies don’t trade smaller timeframes.
If you didn't know, the market is driven mostly by the big banks, institutional traders, and big hedge funds. We call them the smart money traders. These traders have billions of cash to trade on the forex market and a history of data from which to make trades. But this data is not always in hourly or 30-minute charts. No. You’ll find the data on weekly and monthly charts.
When these big money traders get into the market, they force it to change directions to favor them. And any retail trader who trades against them will be caught in the crossfire.
Retail traders like you and I are the ones who trade the smaller timeframes. But if you want to trade like the big banks, you have to at least know what’s going on in their charts. Even if you don’t trade on the weekly and monthly charts, you still need to factor their signals into your trades so that you.
Conclusion
You could survive ignoring weekly and ignoring timeframes for so long. But you can take your trading strategy to the next level by observing the two timeframes.
And on the same topic, what do you think is the best timeframe to trade in forex?