What is Timeframe?
Timeframe is a way of grouping prices to display them on the chart in a more convenient manner.

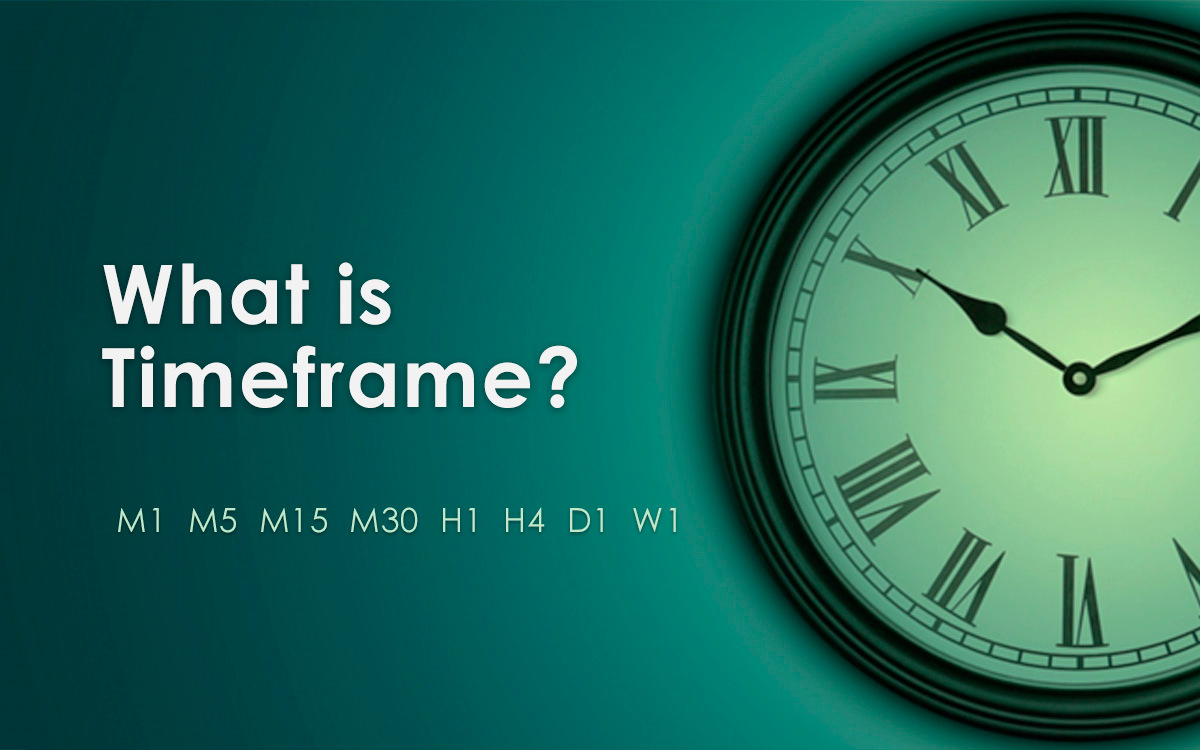
There are numerous types of timeframes, but the following ones are the most common through different platforms:
- M1 (one-minute);
- M5 (five-minute);
- M15 (fifteen-minute);
- M30 (thirty-minute);
- H1 (hourly);
- H4 (four-hour);
- D1 (daily);
- W1 (weekly);
- MN (monthly).
All these timeframes are present in the most popular trading terminal – MetaTrader4 (MT4). So what does all these timeframes M1, M5, M15, M30, H1, H4, D1, W1, and MN mean in Forex trading?
The timeframe label indicates the amount of time one candle refers to. The larger the timeframe chosen by a trader, the larger the time interval encompassed in one candle on the chart.
The choice is not limited to the above-mentioned timeframes. Traders can also make use of non-standard timeframes like three-minute (M3) or two-hour (H2) ones. You can learn how to create a non-standard timeframe manually in MT4 here.
For better clarity, we’ll reveal the essence of timeframes with the following example.
Let’s take the price chart of EUR/JPY on the H1 timeframe. It will look like this:
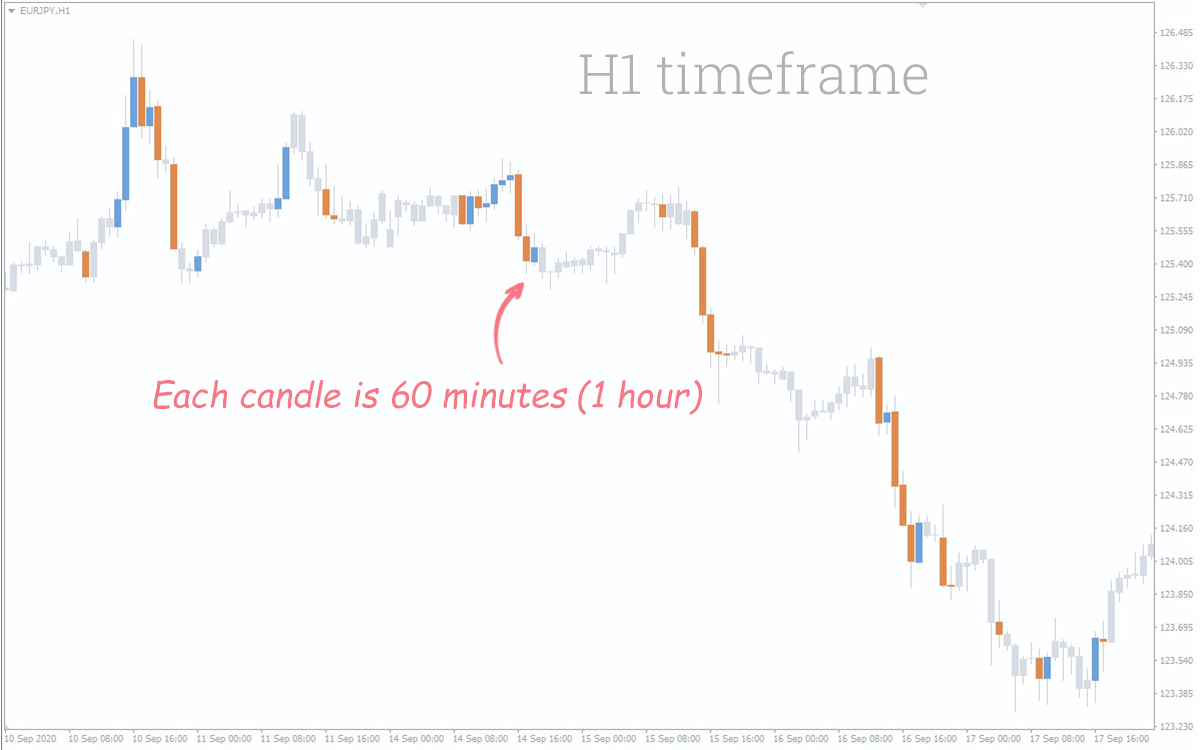
So, what is H1 timeframe in Forex? On H1 each candle on the chart corresponds to one hour. Thus, the chart provides us with information on the opening price, the closing price, the minimum price, and the maximum price over each hour. At that, the visible time interval begins on September 10 and ends on September 17. September 12 and 13 are skipped because they're part of the weekend.
Now let's consider an example of the larger timeframe – four-hour (H4) – shown in the chart below:
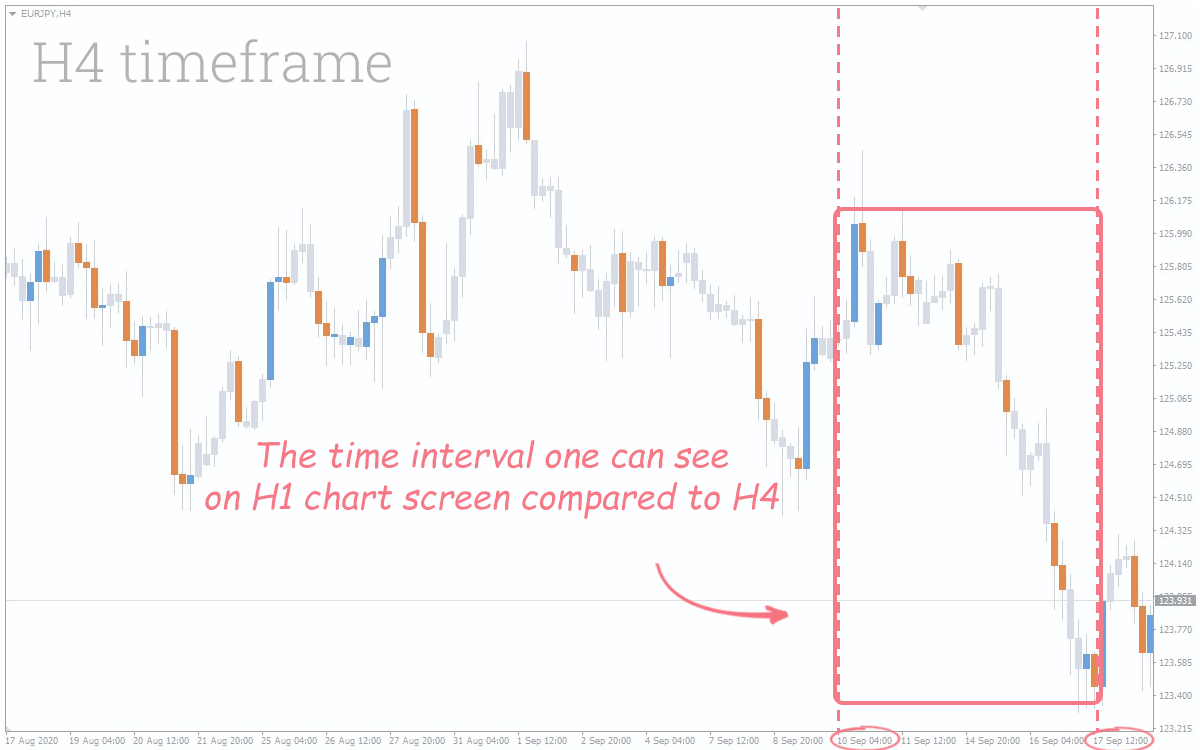
Note that the new chart shows a longer time interval beginning on August 17. That is, the H4 timeframe actually shows us the price movement of EUR/JPY for a month. One candle corresponds to four hours on the EUR/JPY H4 chart.
On the H4 timeframe, we have also selected the time period visible on the previous H1 timeframe – the difference between these two visible time periods is just about 4 times.
Choosing the Timeframe for Trading
Btw, if you are looking to upgrade your terminal with pro indicators and different utilities you can browse a from variety of resources available at FXSSI Product manager.
Now let’s talk about choosing a timeframe in Forex. What is the best timeframe to trade? A clear answer cannot be given here, because it depends on a number of specific features. For example, the nature of your trading system or a general approach to trading. Some traders trade within a day making many trades; others – 1-2 trades during this period, while some make only 1 trade a week.
Despite such a large room for choice, we still advise you to select the timeframes starting from M30 and larger. Moreover, M30 is no worse than other lower timeframes for intraday trading. Why?
The key reason lies in a significant impact of the so-called “market noise” on the price on small timeframes. The “market noise” is a huge number of low-volume trades in the market that randomly affect the price in the short term. The drawback of the “market noise” is a complete failure to predict their impact on the market.
The market is usually affected by the “market noise” on M1 timeframe just about all the time. The given state of the market is easy to determine on the chart: the market lacks a trend, and the price moves chaotically and in a confusing manner. Let’s look at the EUR/USD chart on M1 timeframe:
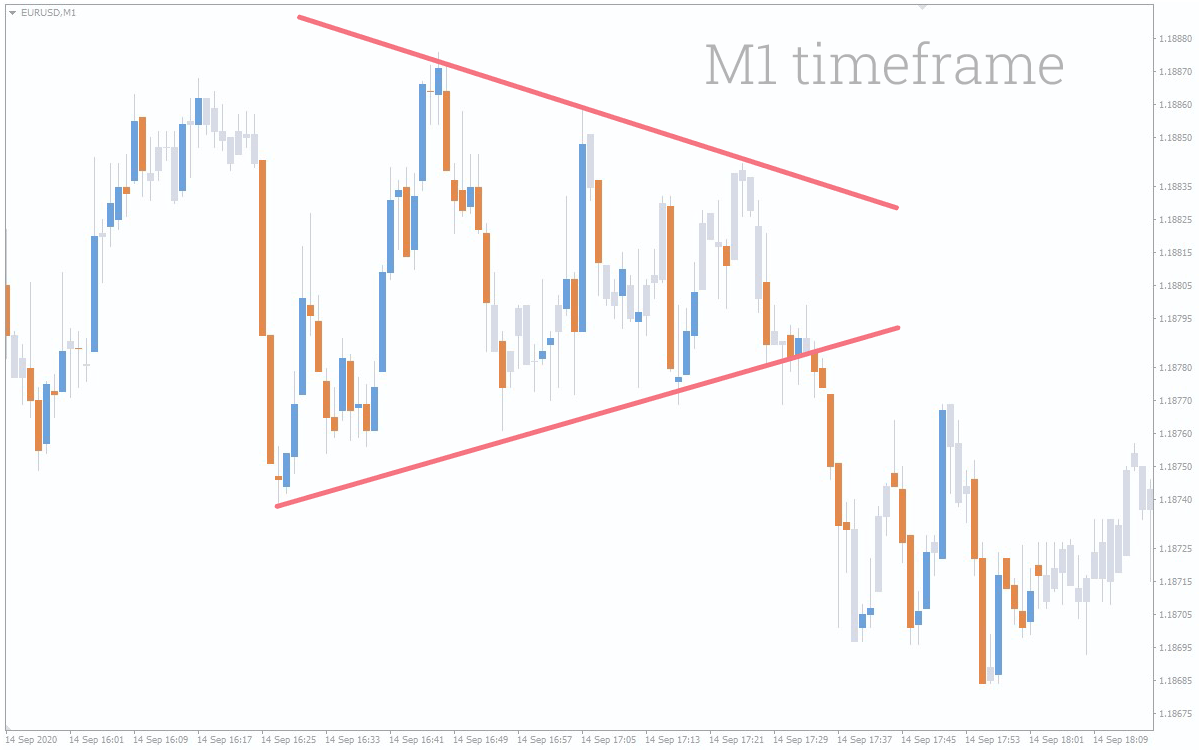
As you can see, the trend direction can be hardly identified: the price first moves down, and then comes a retracement – there is some kind of a “Triangle” pattern. Usually, the price moves in one direction for a long time after the pattern is broken out, but in our case it immediately comes back to the previous level.
This example clearly illustrates that using technical analysis on small timeframes is very difficult.
H1 timeframe is more clear to the market picture.
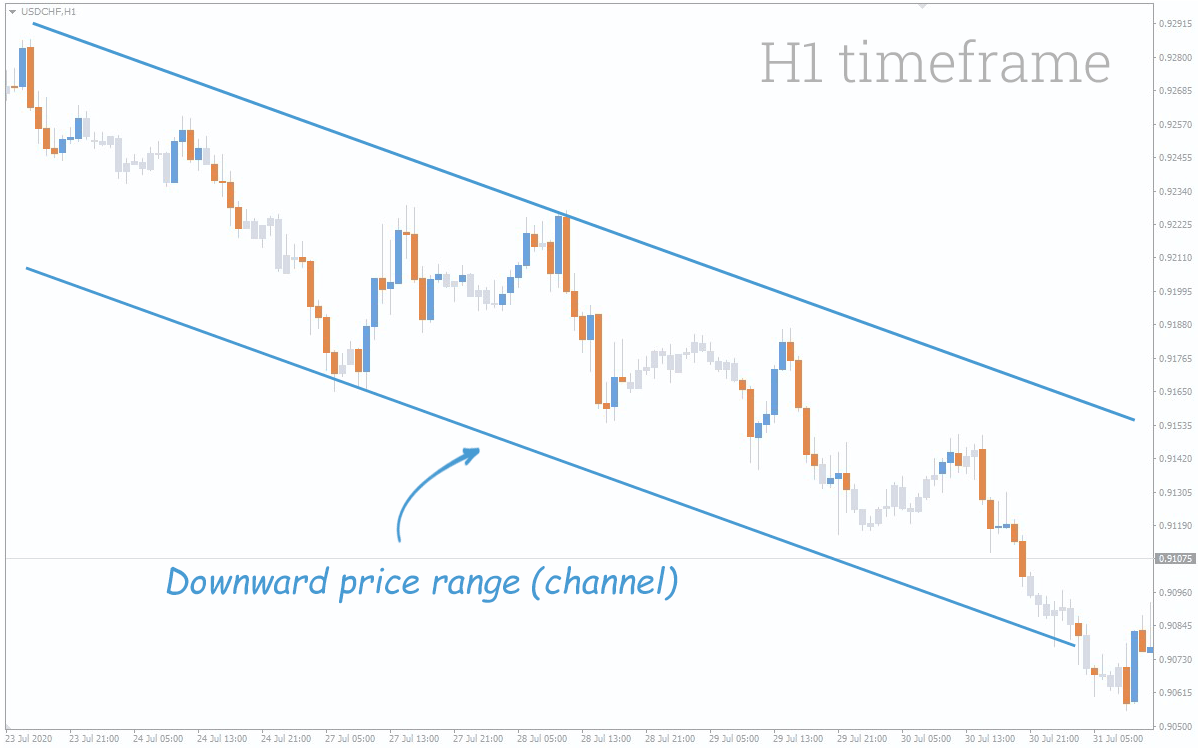
Indeed, the trend is clearly visible on the H1 timeframe. One can even plot the boundaries of the downward price range on the chart. It can be concluded that the larger the timeframe, the clearer signals can be get by analyzing the chart of a currency pair.
Of course, it doesn’t mean that you need to trade on the highest timeframes (D1, W1 or MN) only. Such time intervals are good for very experienced traders who assess the market situation with fundamental analysis and can wait for the right moment to make a trade for weeks or even months.
M30, H1, and H4 timeframes are well suited for newbie traders trading on a regular basis. Patterns of technical analysis, as well as indicators, provide adequate information on these time periods, while you don’t need to wait for a signal to open a position for long.
Another important advantage of these timeframes is that a trader can measure the profitability of their own strategy on a demo account within a short period of time and hence the feasibility of its practical application.
Additionally, you can use multiple timeframes simultaneously depending on the market situation. For example, when important economic news are released, you can decrease a timeframe for trading with more precision and increase it if there is the long-lasting flat market.
For the rest, you shouldn’t focus on choosing the timeframe, since you’ll most likely select the time interval that suits you best by yourself, with time and practice.