Differences Between Support and Resistance vs Supply and Demand
There’s an age-long debate about the differences between supply and demand zones, and support and resistance levels. We share our opinion on this debate in this article.


We’re going to cut the chase and tell you this:
Supply and demand zones are very similar to support and resistance levels. In fact, you would not be committing an unforgivable error by calling a support level a demand level or calling a resistance level supply level. However, there are subtle differences to take note of.
The major difference between support and resistance vs. supply and demand is that the latter two are freshly formed zones on the chart where the price has refused to go past. On the other hand, supports and resistances accumulate from past supply and demand zones.
| Supply and Demand | Support and Resistance |
|---|---|
| New on the chart | Based on past supply and demand levels |
| Not dependent on historical price data | Dependent on historical price data |
| Opportunities to get in on trades quickly | Delayed trade entry opportunities |
In the rest of the article, we dissect what each is so that you can more clearly see the difference between them and how these differences matter in a live chart.
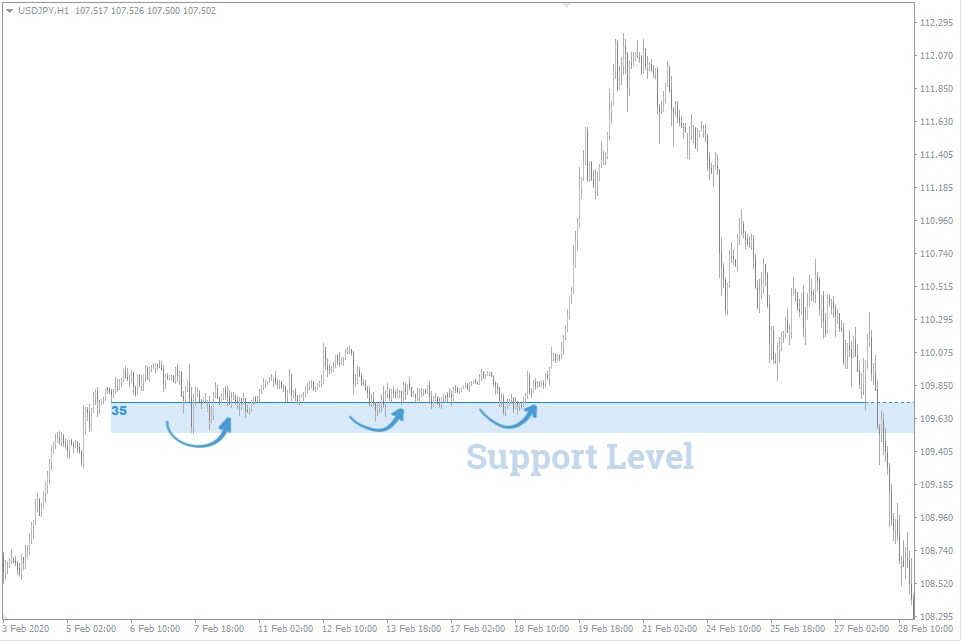
What are Support and Resistance Levels?
Supports are those levels where the price has failed to fall below after multiple trials. Resistances are those levels where the price has failed to rise above after multiple trials.
Traders use support and resistance levels to make critical trading decisions, such as entry and exit prices.
You can refer to this piece on supports and resistance levels if you need more in-depth knowledge.
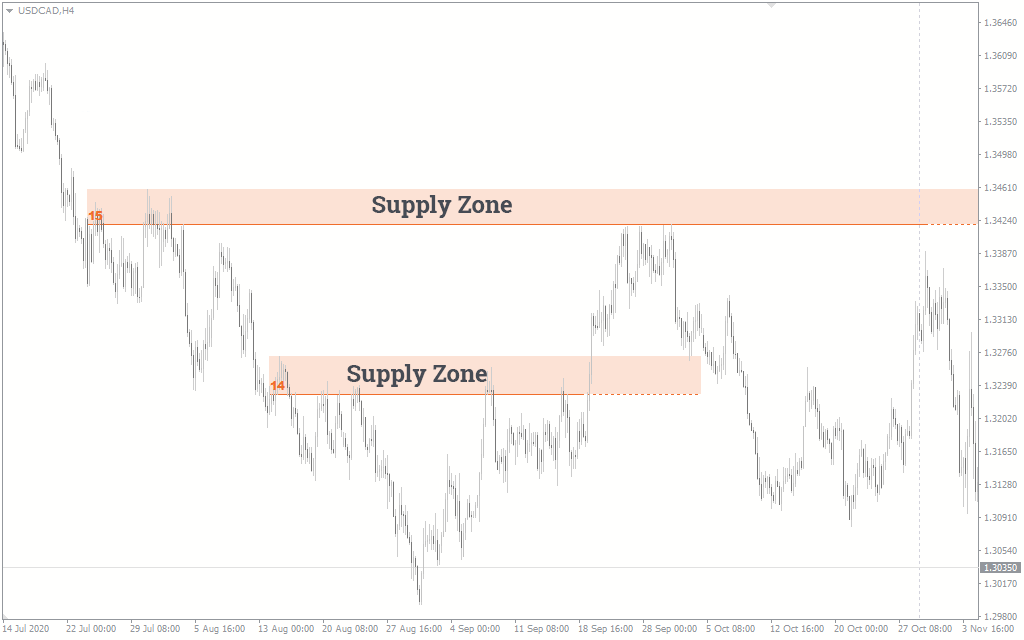
What are Demand and Supply Zones?
Supply and demand zones on the forex charts are levels where there is a sharp imbalance between the number of sellers and the number of buyers, which leads to a sharp rise or fall in the price.
The supply zones are at the top of reversals, while the demand zones are at the bottom. So, prices drop at supply zones and rise at demand zones.
When buy orders outweigh sell others at a time on a chart, there’s more demand for the commodity than supply. A price increase follows such situations. But when the sell orders outweigh the buy orders, this causes the commodity price to fall.
Notice, however, that the number of buyers doesn’t necessarily have to be more than sellers or the other way around before demand and supply set in. If the buyers, for instance, are few but their orders are enormous, they could upset many sellers. This is often seen when the big banks and institutional traders decide to trade the commodity.
Major Differences Between Support And Resistance Vs. Supply And Demand
As we've already mentioned, the differences between these two are subtle. But these subtle differences help some traders make unique trading plans for each pair.
These differences include:
1. Appearance on the Chart
Supply and demand zones appear as new areas on the chart where there’s an imbalance between the buyers and the sellers. This imbalance results in substantial price changes.
The emphasis now is on the newness. Supply and demand levels develop as the chart develops.
On the other hand, support and resistance levels are not formed until the price returns to a level it has once been before and reacts in the same way it reacted on the previous occasion(s).
2. Reliance on Historical Price
Supply and demand zones do not necessarily rely on the historical price of a currency pair. A trained forex trader can recognize them in real-time without referring to historical price data.
On the other hand, support and resistance levels are nothing without historical price data. The price may have to react at a particular level at least twice before being sure that it is a support or resistance level.
Thanks to this difference, it is easier to develop tools and indicators for support and resistance than demand and supply levels.
This differing reliance on historical price data brings us to the third difference between support and resistance levels and supply and demand zones.
3. Trading Opportunities
Another difference is the trading opportunities that each pair provides.
For instance, you can trade supply and demand zones as they develop newly on the chart without needing to refer to historical price data. This allows you to get into trades quickly and catch big moves before they happen.
On the other hand, support and resistance levels are slightly slower because you have to wait until the price returns to a level before you trade the currency pair. You can’t even be sure that a support or resistance level has formed until the price touches the level at least twice. By this time, you might have missed out on the opportunity.
In essence, support and resistance levels are just supply and demand zones that have been projected forward so that the price reaches these projections again and again.
Conclusion
Now you might be thinking that the difference is so subtle that the debate is almost not worth it. More like asking for the difference between a flashlight and a torch!
But the more you do your research on the topic, you’ll find that traders have come up with ways to take advantage of the slight difference between the two so much that they are beginning to seem very different.
Remember that although they are similar and almost mean the same thing, you can come up with a way to either combine them and enjoy the best of both terms or separate them and benefit from the advantage one has over the other.
How you choose to go about trading support and resistance levels and supply and demand ones is left to you.