Keltner Channel vs. Bollinger Bands - How to Use in Trading
The Keltner channel and the Bollinger bands may look alike while looking at them from a distance. However, they differ in so many ways.

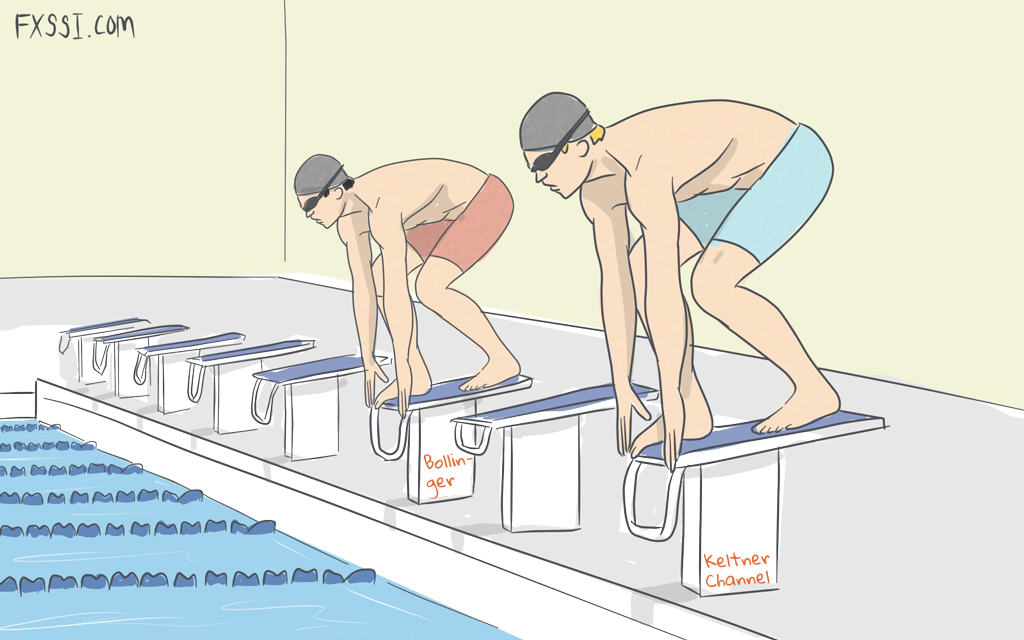
Chances are that you found out about the Keltner channel by casually flipping through your indicator list, and you have never come to know how you can combine it with other tools to form a powerful strategy.
We will explore the differences between the Keltner channel and the Bollinger bands, some pitfalls to avoid, and how to use them to form a profitable strategy.
Differences Between Keltner Channels And Bollinger Bands
What exactly is the difference between Bollinger bands and the Keltner channel? Well, there's a slight difference in how they look on the chart and even more in how they are used.
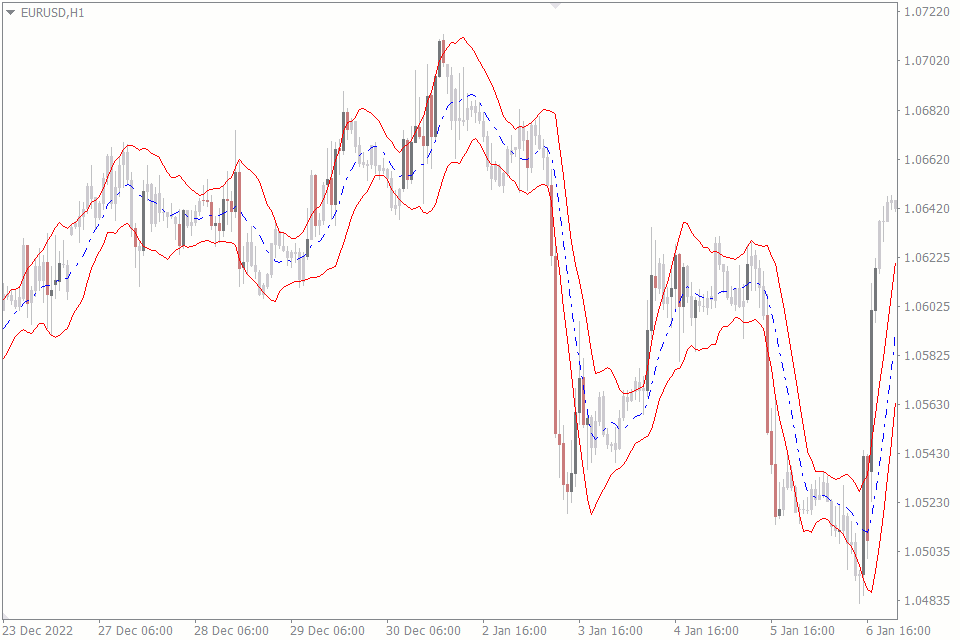
Keltner Channels use a moving average and a volatility-based calculation to plot the upper and lower bands, while Bollinger Bands use a standard deviation calculation.
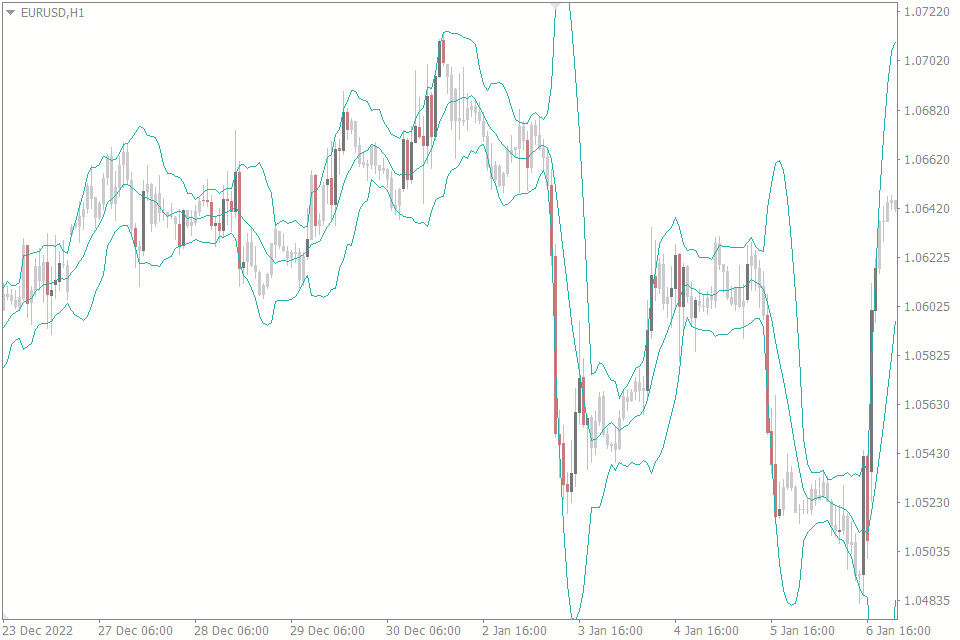
Bollinger Bands are best used for short-term trading, as they respond quickly to price changes. Keltner Channels are better for longer-term trading as they are less affected by short-term volatility.
Although combining two indicators of the same type usually provides a slight advantage, using the Keltner channel and Bollinger bands can provide traders with a more comprehensive view of a security's price action.
For instance, you can use Bollinger Bands for short-term signals and Keltner Channels for longer-term signals, which helps you to make more informed trading decisions.
Here's a table you can always refer to if you have to compare them often:
| Keltner Channels | Bollinger Bands |
|---|---|
| It can be used for longer-term signals | It is often used to give short-term signals |
| They are not easily affected by short-term volatility | They respond quickly to the slightest change in the volatility of the market |
| It uses a volatility-based calculation to plot the upper and lower bands | Plots the upper and lower band using a standard deviation calculation |
| Performs better than the Bollinger Bands during a ranging market | Performs better than the Keltner Channel during a trending market |
Using Keltner Channel and Bollinger Bands
The number of ways we can use these two indicators is practically unlimited; let's explore just a few of them:
One basic but successful trading strategy is to buy when the security's price touches the lower Bollinger Band and sell when it touches the upper Keltner Channel.
Another strategy is to watch for bullish/bearish divergences between the security's price and the Keltner Channel's moving average.
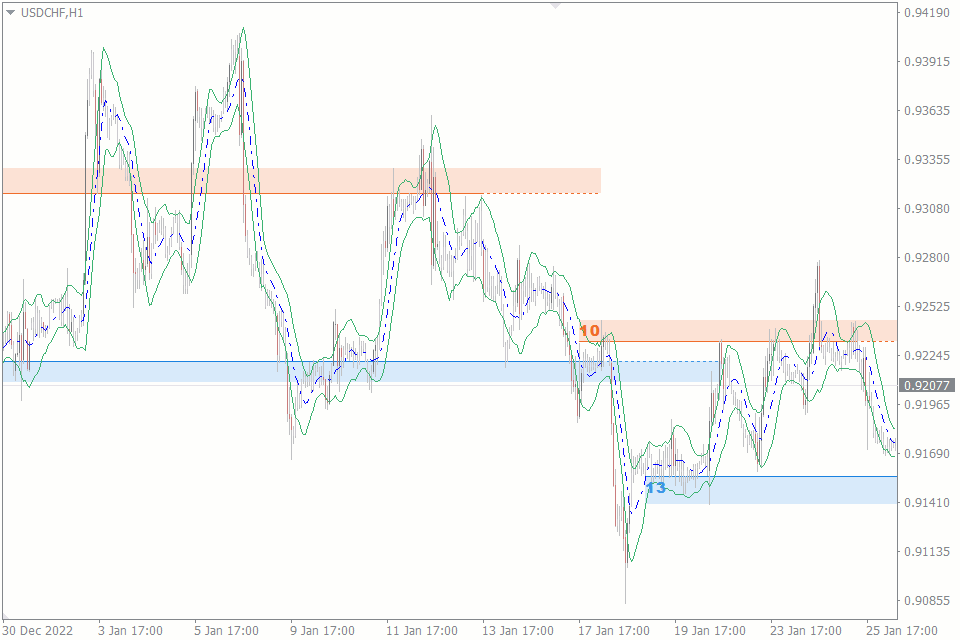
To get the most out of these indicators, it is vital to use them in conjunction with other technical analysis tools, such as trend lines and support/resistance levels. It's also essential to use the indicators on multiple timeframes to better understand the security's overall price action.
As with any technical indicator, it is essential to remember that Keltner Channels and Bollinger Bands are not a guarantee of future performance and should be used as a part of a comprehensive trading strategy.
To get the best out of these indicators, you should use them when the market is trending because these indicators can produce false signals during choppy markets or low-volume conditions.
Caveats And Potential Pitfalls
One potential pitfall of using Bollinger Bands is that they can provide false signals in a ranging market. In a ranging market, the price of an asset moves within a certain range, and the Bollinger Bands can become too close together, providing little or no clear indication of a potential buy or sell signal.
Another pitfall of using Bollinger Bands is that they can be subject to interpretation. The bands can be adjusted to suit different trading styles, and different traders may interpret the same set of bands differently.
Keltner Channels also have their own set of caveats. One is that they are based on the average true range, which is a volatility indicator. This means that during low volatility periods, the Keltner Channels will be narrow and may not provide clear buy or sell signals.
Also, Keltner Channels are sensitive to the period used to calculate the average true range. A shorter period will result in wider channels and more potential signals, while a longer period will result in narrower channels and fewer potential signals.
The Keltner Channel and Bollinger Band Squeeze
Remember that we get our best results while using these indicators in a trending market. What, then, does the indicator tell us when the market is consolidating? What can it be preparing us for?
Trading the squeeze is the same either while using the Bollinger bands or the Keltner channel, so we will focus on using one for our illustration.
The squeeze happens when the market is experiencing low volatility. According to John Bollinger, periods of high volatility follow low volatility. Hence, we prepare for Bollinger bands to give us a signal when the volatility is about to shoot up.
How does it do that? Simple.
After a squeeze, if price aggressively pierces either of the upper or lower bands, it is likely to follow through in that direction, and that could be our signal to jump on the bandwagon.
That is, if after a Bollinger band squeeze, the price pierces the upper Bollinger bands, I can simply buy the asset and hope it follows through the newly established trend.
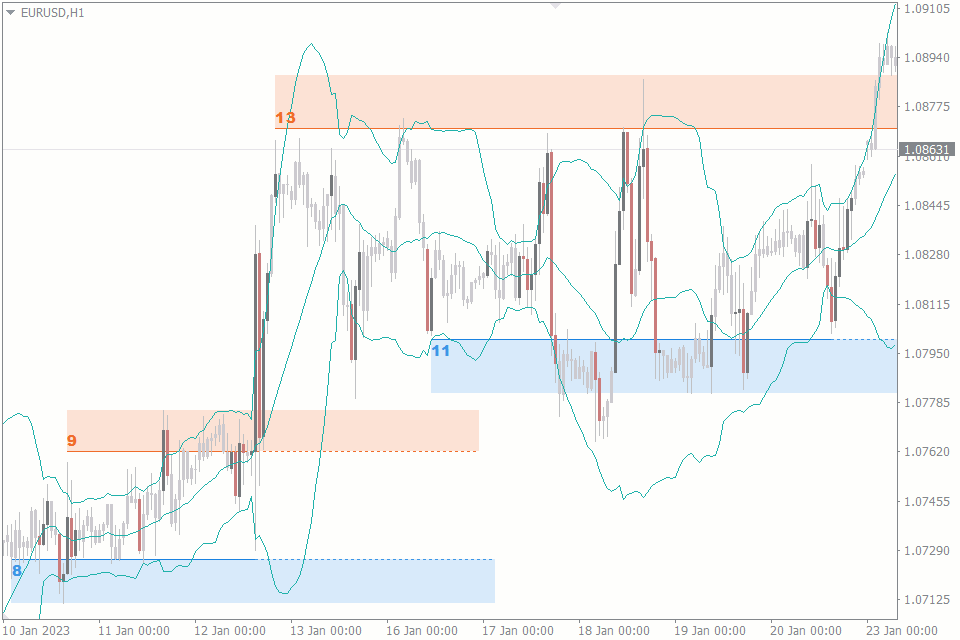
We can get better results using Bollinger bands and the Keltner channel alongside support and resistance to form a strategy. For example, trading the squeeze setup is more reliable when combined with Support and Resistance indicator.
Conclusion
Deciding to choose either of the indicators boils down to your personal preferences and your trading style. For example, an intraday trader might choose the Bollinger Bands over the Keltner Channel because it reacts faster to price.
On the other hand, the swing trader might rely on the stability that the Keltner Channel offers.
Remember that your results will be astronomically improved when you confluence any of the indicators with other technical tools or indicators.