How to Identify a Trend in the Forex Market?
A trend is a directional price movement. The ability to correctly identify a trend can significantly increase your trading performance.


There are three types of trends:
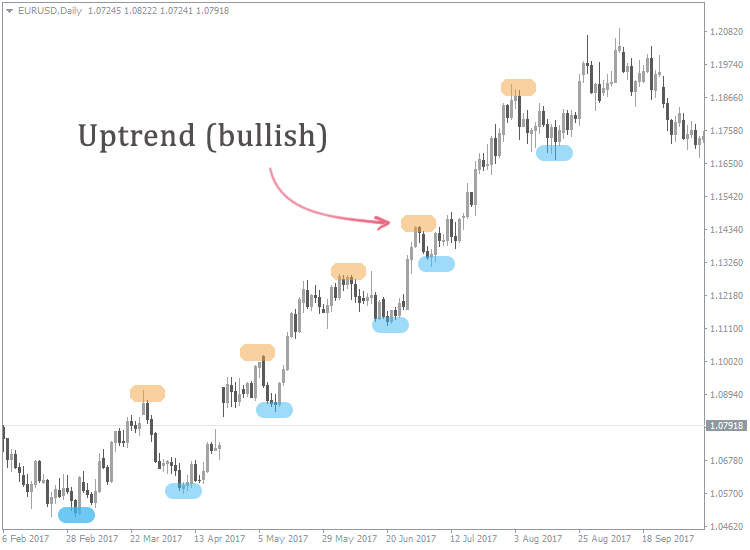
- Uptrend (bullish).
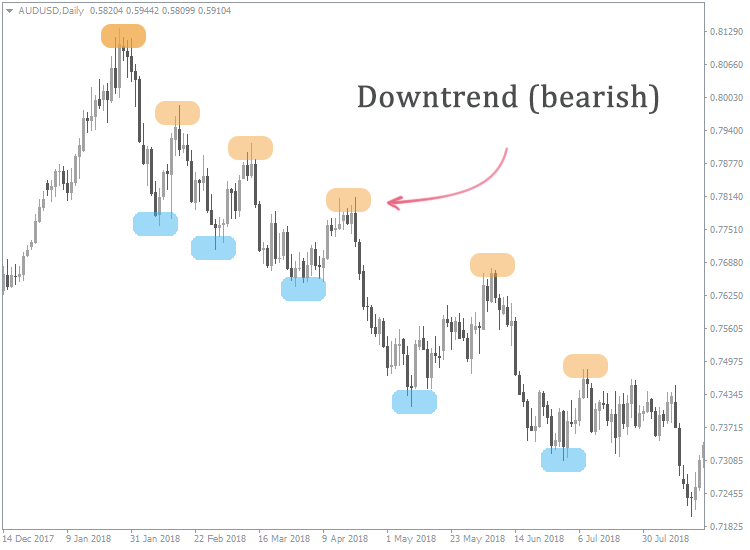
- Downtrend (bearish).
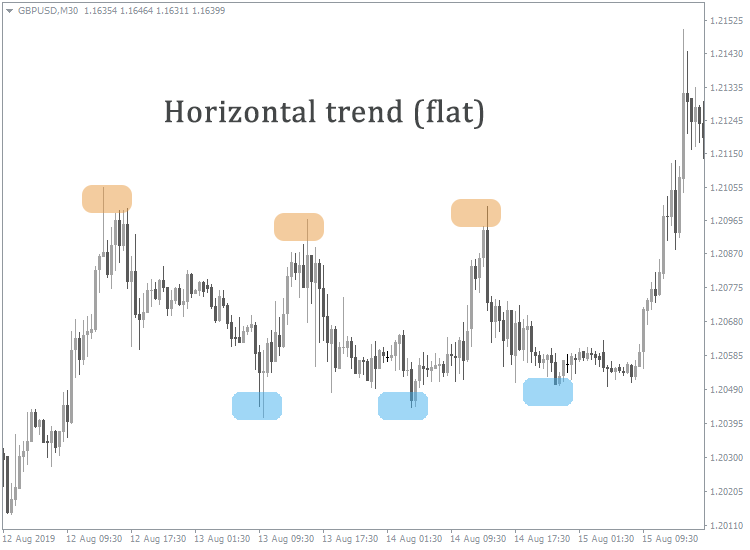
- Horizontal trend (flat).
An uptrend is a sequence of rising highs and lows where each subsequent high and low is above the previous one.
A downtrend is a sequence of falling highs and lows where each subsequent high and low is below the previous one.
A horizontal trend is a price movement without a clearly defined upward or downward direction. Highs are almost on the same level or are located chaotically. Lows lie along a conditional horizontal line as well or don’t have a clear logic behind their location.
We should note that real-world trends rarely fit the definition with 100 percent accuracy. For example, you may come across an uptrend where the next high is lower than the previous one or a downtrend where a too high low stands out against the overall market picture.
These exceptions to the rules are unavoidable since the reality always differs from theory. In real-world trading, it’s reasonable to consider as a trend such a price movement that fits the definition the most.
Having identified a trend correctly, you can get an approximate forecast for the price movement. Of course, in practice, the price can repeatedly deviate from the main direction. However, the trend allows you to understand a very crucial thing – which direction is more profitable to trade in.
It’s not easy to accurately determine a trend reversal, so trading against it often results in losses and can be risky. That's why it’s much more reasonable to trade towards the trend.
Tips to help you make use of a trend in your trading in a more efficient way:
- It’s better to place Buy orders in case of an uptrend;
- It’s better to place Sell orders in case of a downtrend;
- If the trend is not clearly defined, it would be wise to refrain from trading since it’s hard to predict the price movement in this case. However, if the price forms a clear sideways corridor with sufficient height, you can sell in its upper zone and buy in the lower one.
How to Identify a Trend on the Indicator-Free Chart
The most obvious way to identify a trend is to analyze the price movement on the chart visually. It’s important to note how highs and lows are located. Depending on their location on the chart, you can determine whether the movement is ascending, descending, or horizontal.
Signs of a trend:
- Each low is lower than the previous one in a downtrend, and each high is higher than the previous one in an uptrend.
- In the case of a trend, the upward or downward tendency is constant. For example, if we’re looking at the hourly chart, a sharp price increase within a few hours is not a trend. However, if a constant price increase is wave-like, it can already be referred to as a trend.
- Price retracements in relation to its major movement are usually minor, and the price quickly comes back to its previous values.
We can also note some characteristics of a trend that are not mandatory but can be observed quite often.
- Trend often starts with a strong price impulse and ends in the same way.
- Before the opposite trend begins, the price often goes into a flat state, staying in it for some time. The given price behavior may be a signal for profit-taking.
You should keep in mind that trends may differ in various timeframes. For example, a trend may move up on the daily chart, while falling on the hourly chart. In this case, the higher timeframe has a higher priority, but short-term bearish trades are allowed if focusing on the hourly timeframe.
You should not forget that the price can change its movement direction when it hits a significant level on the daily timeframe.
Therefore, it may be useful for a trader to know how to identify a trend reversal in the market.
Some traders distinguish between the concepts of trend and tendency. Technically, there is no clear difference. However, it’s commonly believed that tendency is a more general concept. It is not always clearly defined, while the trend is usually very noticeable and has well-defined characteristics.
How to Identify a Trend Using Indicators
Sometimes a trend is less clearly defined, so it’s hard to identify it unambiguously on the indicator-free chart.
In these cases, trend indicators come to help traders. Let’s consider some of those available in the MT4 trading terminal by default.
It’s important to understand that trend indicators are only efficient under trending conditions and often don’t work when the price moves sideways.
To add a trend indicator to the chart, go to “Insert – Indicators – Trend” in the MT4 menu and select the one you need.
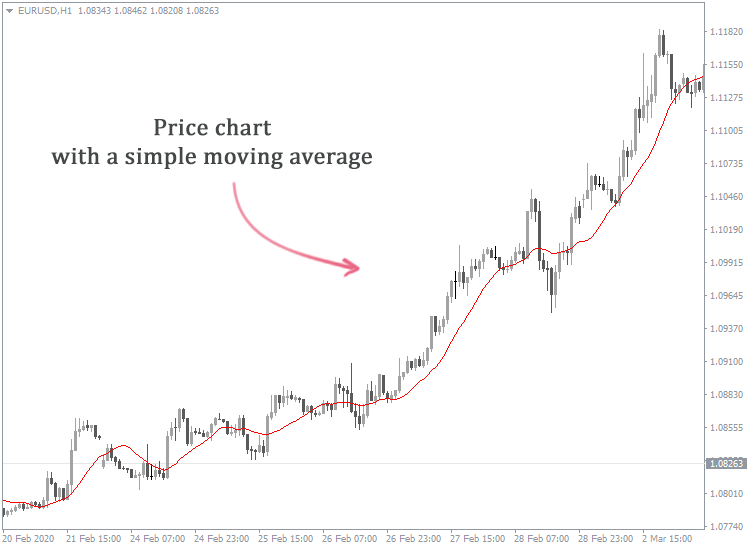
Moving Average
The given indicator is one of the simplest and most used as the basis for developing other indicators. The moving average shows the average price value for a particular period.
The closing prices of the last and more distant candlesticks can be taken into account with different statistical weights. Depending on this, there are several types of moving averages: simple, weighted, smoothed, and exponential.
Moving average is often seen as a kind of support or resistance – however, not as straight lines, but as curves moving in time.
Many strategies have been developed based on a moving average, and almost all of them use a common approach:
- If there is an uptrend, it’s better to make a Buy trade when the price hits a moving average from above and keeps on moving towards the trend.
- If there is a downtrend, it’s better to make a Sell trade when the price hits a moving average from below and keeps on moving towards the trend.
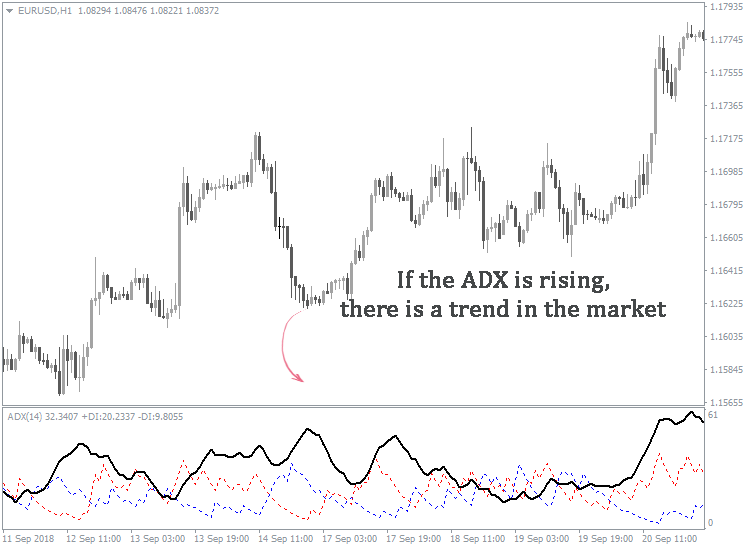
Аverage Directional Movement Index (ADX)
It is the index of the average movement direction. It is displayed below the chart of a currency pair and comprises three lines:
- Positive directional indicator +DI;
- Negative direction indicator -DI;
- The ADX itself.
Using the ADX indicator, you can determine the trend presence and find the best time for making trades and profit-taking.
A Buy signal (in an uptrend) is generated when +DI rises above -DI.
A Sell signal (in a downtrend) is generated when -DI rises above +DI.
Both signals are valid only if the ADX itself is rising, which indicates the presence of a trend.
And if the ADX is falling, it's time to think about profit-taking.
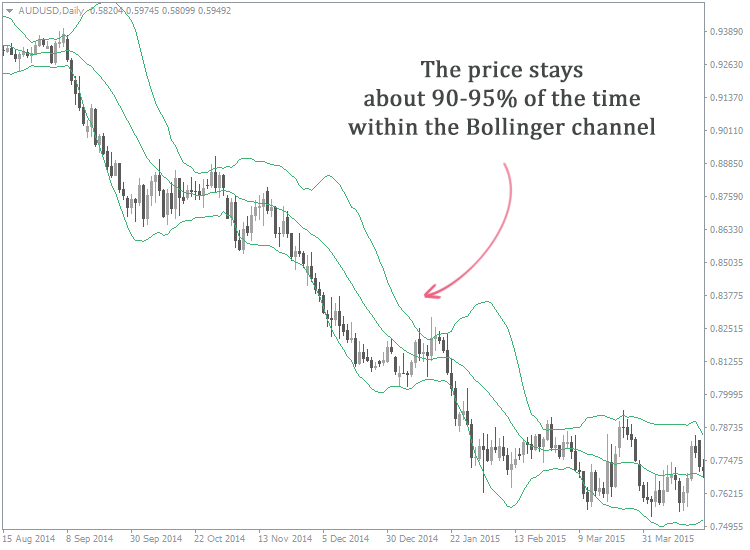
Bollinger Bands
The given indicator is a set of three curves drawn based on moving averages and displayed on the chart of a currency pair.
The Bollinger channel boundaries are not fixed and depend on the volatility of a financial instrument.
If there is no clear-cut trend, the price deviates slightly from the midline. As soon as the trend gains strength, the deviations become larger, and the channel's boundaries diverge.
Bollinger Bands have a useful feature: the price stays about 90-95% of the time within the channel. These observations provide the basis for the development of various trading strategies.
As a rule, the Bollinger bands indicate:
- Buying in an uptrend, if the price has tested the middle line from above and is heading towards a trend;
- Selling in a downtrend, if the price has tested the middle line from below and is heading towards a trend.
Envelopes
This indicator is also based on two moving averages, one of which is shifted upwards, and another one – downwards. The higher the market volatility, the greater the distance between the lines.
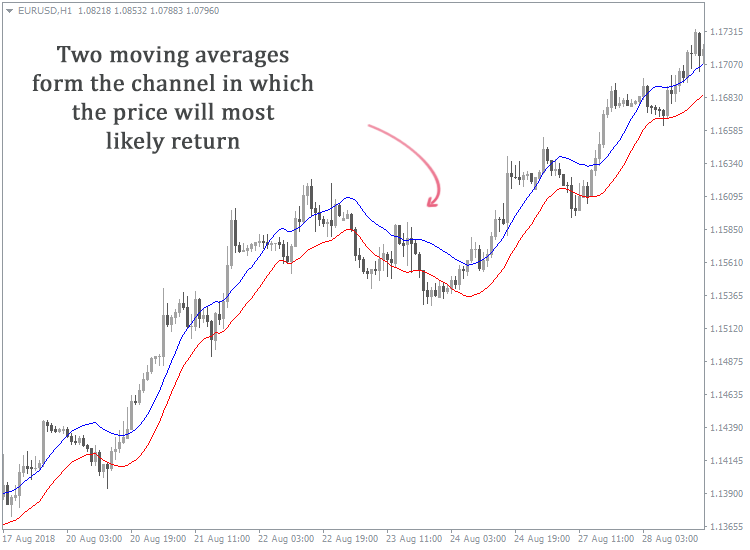
Thus, both lines form a kind of a channel, within which the price will most likely stay. That is, if the price has moved outside the boundaries, it should come back in the nearest future.
Therefore, the following logic lies behind the strategies of trading with the “Envelopes”:
- If the price reaches the lower line during an uptrend, this is a signal to buy.
- If the price reaches the upper line during a downtrend, this is a signal to sell.
Ichimoku Kinko Kyo (Ichimoku Indicator)
Many novice traders are afraid to use this indicator since they consider it too complicated. However, the Ichimoku indicator can accurately determine not only the presence of a trend but also spot support and resistance, as well as the best market entry points.
Unlike most technical analysis indicators that require confirm signals, one might call the Ichimoku a self-contained trading system.
The usage of the Ichimoku indicator in trading is a very massive and fascinating subject that deserves a separate discussion. In this article, we’ll describe only the general principle behind it.
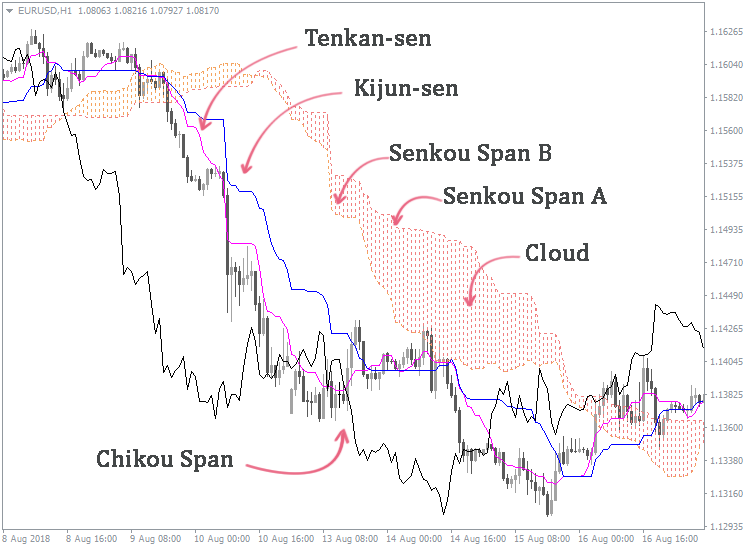
As a rule, the Ichimoku indicator works better on daily and weekly charts. It consists of five lines.
Tenkan-Sen is a 9-period moving average line, which reflects a short-term trend. The steeper its slope, the more clear-cut the trend movement.
Kijun-Sen is a 26-period moving average. If the price moves above this line, it indicates an uptrend, when it makes sense to consider buying. In contrast, the price movement below the Kijun-Sen line indicates a downtrend, when it’s more reasonable to make Sell trades.
Senkou A is the first leading line of the indicator. It is the middle line between the Tenkan-Sen and the Kijun-Sen plotted by their average period in the future.
Senkou B is the second leading line, which is also the middle line between the Tenkan-Sen and the Kijun-sen. But it is plotted by the Kijun-Sen period in the future.
Chinkou Span is the chart drawn by closing prices and plotted by the Kijun-Sen period in the future. It serves for the final confirmation of signals.
The Ichimoku indicator hatches the area between the Senkou A and the Senkou B. It is called the cloud. If the price stays inside the cloud, it indicates a sideways movement. The Senkou A broken out by the price will indicate the beginning of an uptrend, while the Senkou B broken out by the price will signal the beginning of a downtrend.
Parabolic SAR
This indicator looks like a series of points placed above or below candlesticks. If they are below the price, this is a sign of an upward movement. If the dots are above the price, it moves downward.
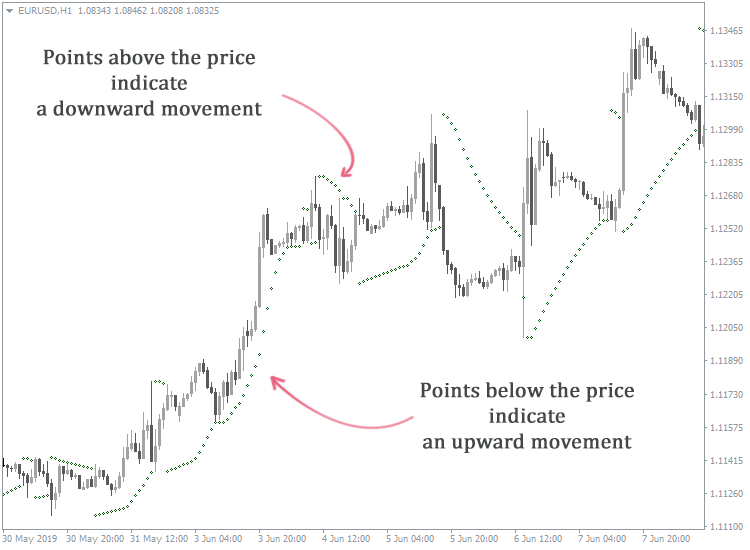
The Parabolic is useful for recognizing the pivot points. For example, as soon as the first point occurs above the price, while the previous points constituting the line are below the price, this indicates the beginning a possible uptrend.
Note that the points are displayed even if there is no trend. In this case, the lines above and below candlesticks will be about the same in length and often interrupted. In other words, the indicator generates many false signals during weak trends.
If there is a clear trend, the points form long continuous lines. They give way to shorter lines on the opposite side of candlesticks during retracements.
Standard Deviation
This indicator is presented as a curve below the price chart. It displays the amplitude of price swings relative to a moving average, namely, the market volatility.
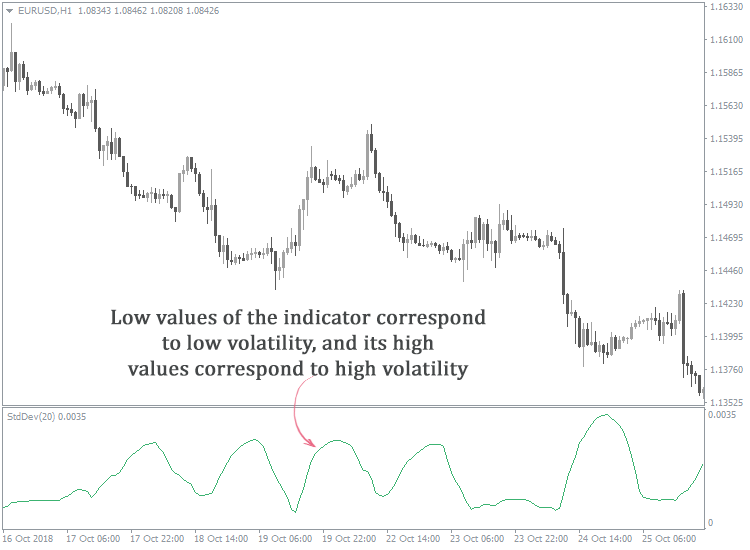
If the Standard Deviation value is low, the market is “sleeping”. Conversely, if the indicator value is high, the volatility is significant. In both cases, it’s reasonable to refrain from trading this financial instrument. The average values of the indicator are considered optimal for trading.
Standard Deviation is rarely used in trading as a stand-alone indicator. It’s most often used in conjunction with other analysis tools.
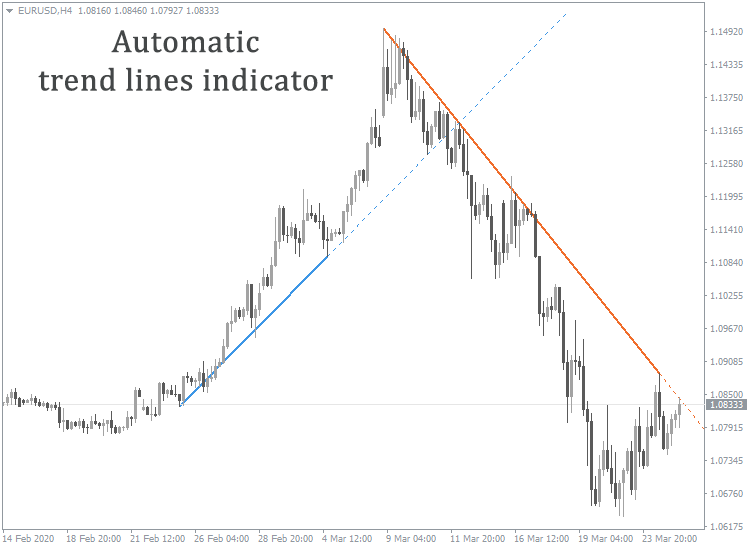
How to Use Automatic Trend Lines Indicators
A trend line is a trading tool that allows you to predict the price movement direction and place orders based on the performed analysis.
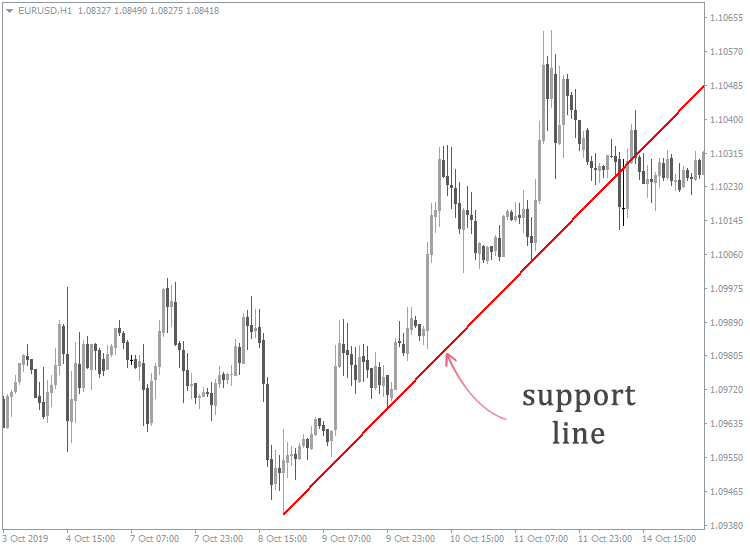
A trend line is a straight line connecting lows on the uptrend chart or highs on the downtrend chart. These lines can act as support and resistance lines.
Simple but efficient trading strategies are developed based on trend lines. As a rule, they have a common plan of actions:
- Buy trade is made during an uptrend if the price tests the support line and reverses towards the trend.
- Sell trade is made during a downtrend if the price tests the resistance line and reverses towards the trend.
For strategies to be efficient, you have to know how to draw trend lines correctly.
If you often rely on trend lines in your trading, our Trend Lines indicator will make your work easier and relieve you of the need to draw lines manually every time.
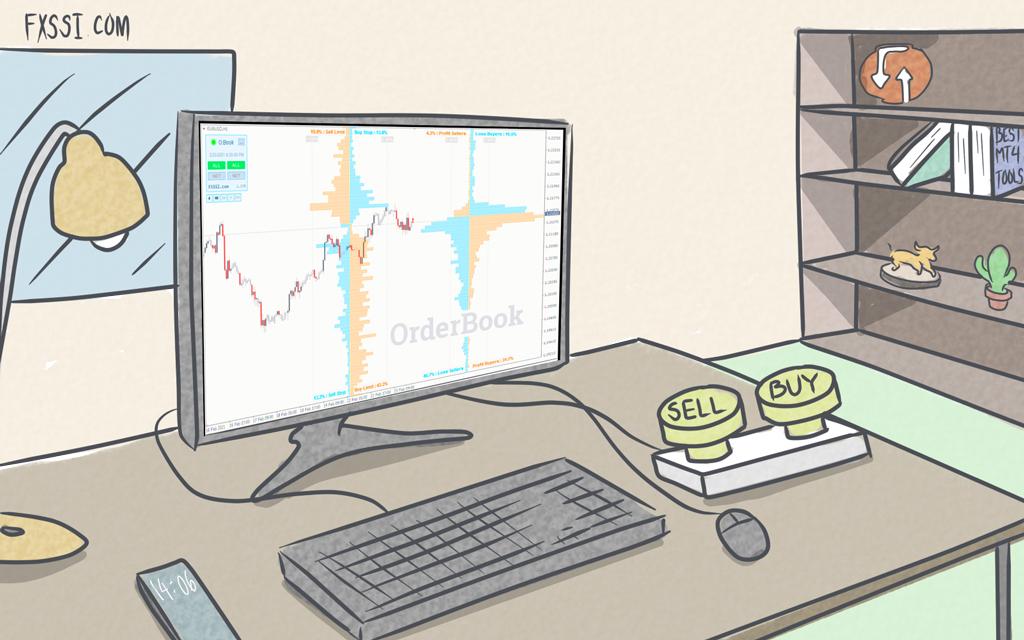
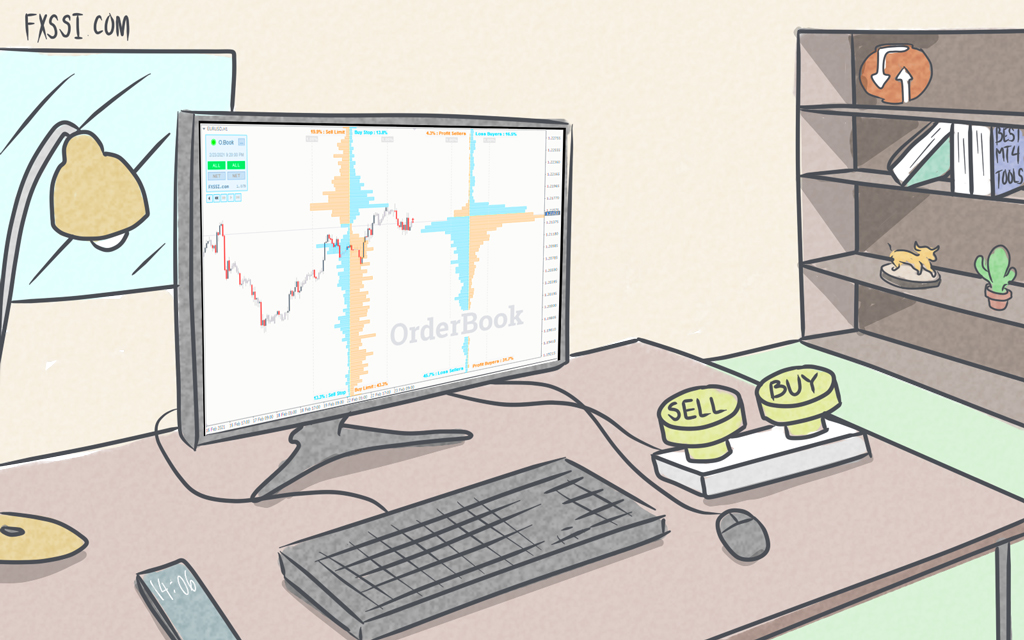
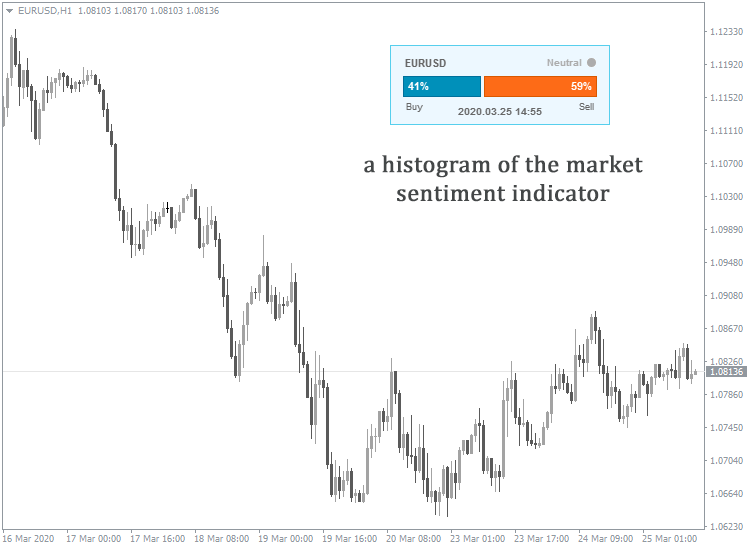
How to Use Market Sentiment Indicators to Identify a Trend
Market sentiment is the dominant emotional state of market participants when it comes to price movements.
For example, sometimes you can say with a certain degree of confidence that most market participants are in the mood for selling. In such cases, we can see an uptrend.
In other cases, traders are more willing to buy a currency pair, and we can talk about a downtrend.
If you analyze the market sentiment correctly, you can predict the percentage of traders willing to place Sell orders and those willing to place Buy orders. Accordingly, it will help you understand which positions will more likely yield profits.
Perhaps the market sentiment analysis may seem more ambiguous than technical analysis, but it can provide a deeper understanding of the market.
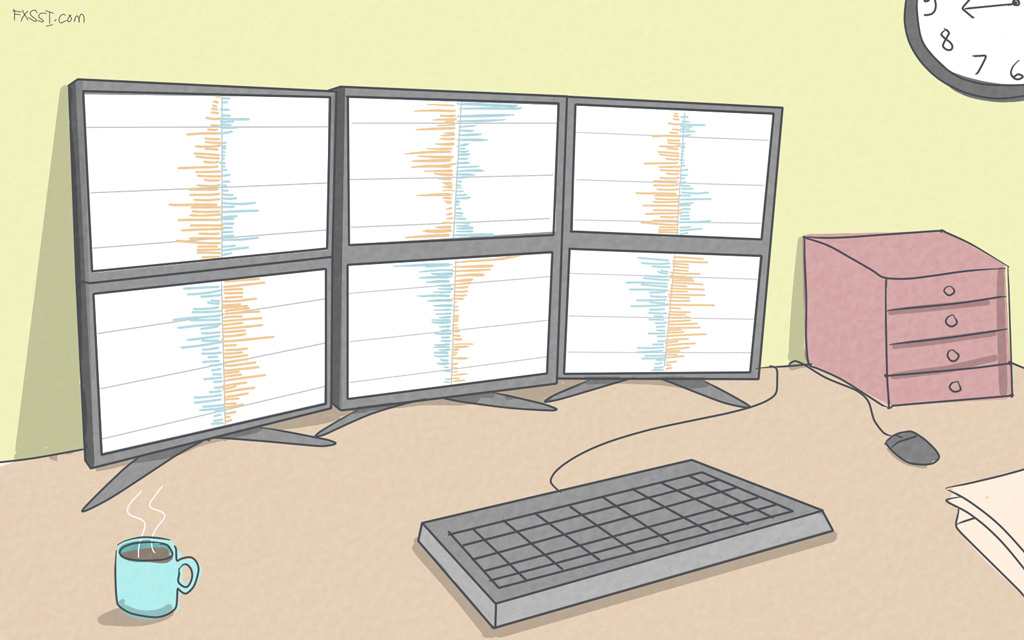
For a more objective analysis, we recommend you to use a number of indicators.
The free Sentiment.Lite indicator displays the ratio of bulls and bears as a histogram.
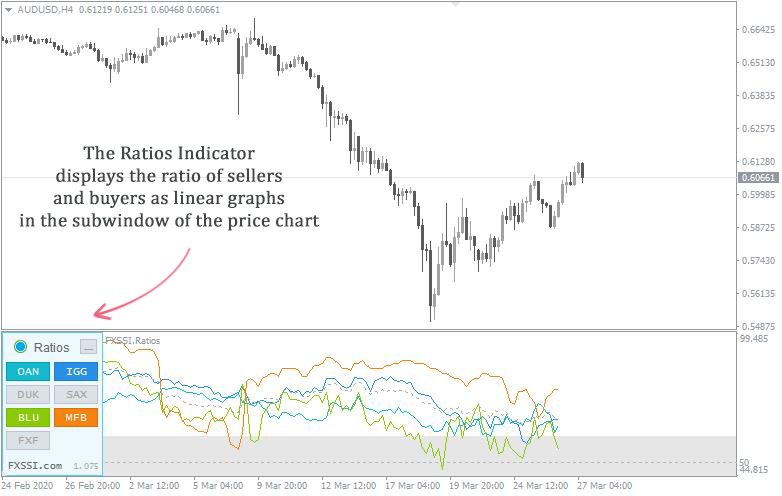
The Ratios Indicator displays the balance between buyers and sellers as curves below the price chart.
The Profit Ratio indicator is based on the logical statement that only buyers can profitably trade in an uptrend, and only sellers can profitably trade in a downtrend.
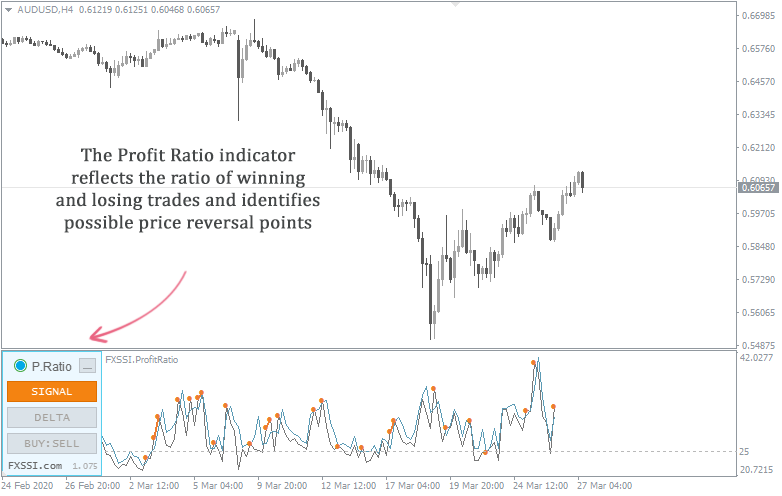
The indicator also shows potential price reversal points by measuring the percentage of winning and losing trades.
Why Does a Trader Need a Trend?
A trader makes money on exchange rate movements, and a trend is a movement. Accordingly, a trader can benefit the most from following a trend. For that reason, an indicator or a tool that can determine trends with accuracy is considered the market’s Holy Grail.
There are also counter-trend strategies, and those that profit from the price noise, but the highest earnings come from trend movements.
Besides, trading with a trend is less risky since it allows you to open trades with an acceptable risk-to-profit ratio.