Trendline Trading Strategies – Breakouts and Reversals
A trendline trading strategy is one of the most popular choices amongst Forex traders.


Trendlines allow you to focus on price action while keeping your charts free of messy indicators that look like a 5-year-old’s finger painting. – Yeah, you know what I’m talking about!
When it comes to developing a Forex trading strategy, just remember that trendlines are not the holy grail. They’re simply a tool to help you identify trends and make intelligent risk management decisions when the market indicates a change.
Let's go over using the Auto TrendLine indicator for MT4 to draw the most efficient trendlines. Then we'll apply the indicator to some trendline trading strategies for breakouts and reversals.
With the help of the Auto Trendline indicator for MT4, you can implement whichever trendline trading strategy fits your style.
The FXSSI Auto TrendLines Indicator for MT4
The Auto TrendLine MT4 Indicator from FXSSI, is an indicator that helps minimise errors in your trendline trading strategy.
If you’ve ever wondered which are the most efficient highs or lows to draw your trendline points from, then this MT4 indicator is perfect for you. No longer do you have to manually draw and update trendlines on your chart. Just let the indicator do the work for you.
As you can see, there are only ever a maximum of 2 trendlines on your chart at any time.
- A bullish trendline in blue.
- A bearish trendline in red.
The Auto TrendLine trading indicator won’t clog up your chart with unnecessary lines. It determines whether price has invalidated a particular line and automatically removes it from your chart.
Click here to download the FXSSI Auto TrendLine indicator for MT4.
How to use Trendlines – Breakout and Reversal Strategies
With the Auto Trendline indicator helping to identify and efficiently draw lines on your charts, let’s get into how to use trendlines in your trading.
Like all trading strategies that implement support and resistance, efficient trendline trading can be classified into 2 categories:
- Breakouts – When price no longer respects the trendline as support/resistance, breaking through the level.
- Reversals – When price continues to respect the trendline as support/resistance, bouncing from the level.
Each type of trendline trading strategy is outlined and analysed below.
Trendline Breakout Strategy
The first trendline trading strategy that you can implement is the breakout strategy.
Breakouts can provide some of the most explosive moves in Forex. By using this breakout trendline strategy, you’re putting yourself in a position to profit from them when they occur.
For best results, only look to buy while the market is in a higher time frame, bullish trend. Or only looking to sell, while the market is in a lower time frame bearish trend.
In this example, we’re looking to buy.
How to trade when taking a long position:
- Identify a bearish trendline on your chart in red.
- When a trendline breakout occurs, take a long position.
- For a conservative entry, wait for a retest of the broken trendline resistance as support.
Place your stop loss below the previous swing low and target a risk:reward ratio that works for you.
Remember, you can follow the steps in the opposite direction when taking a short position.
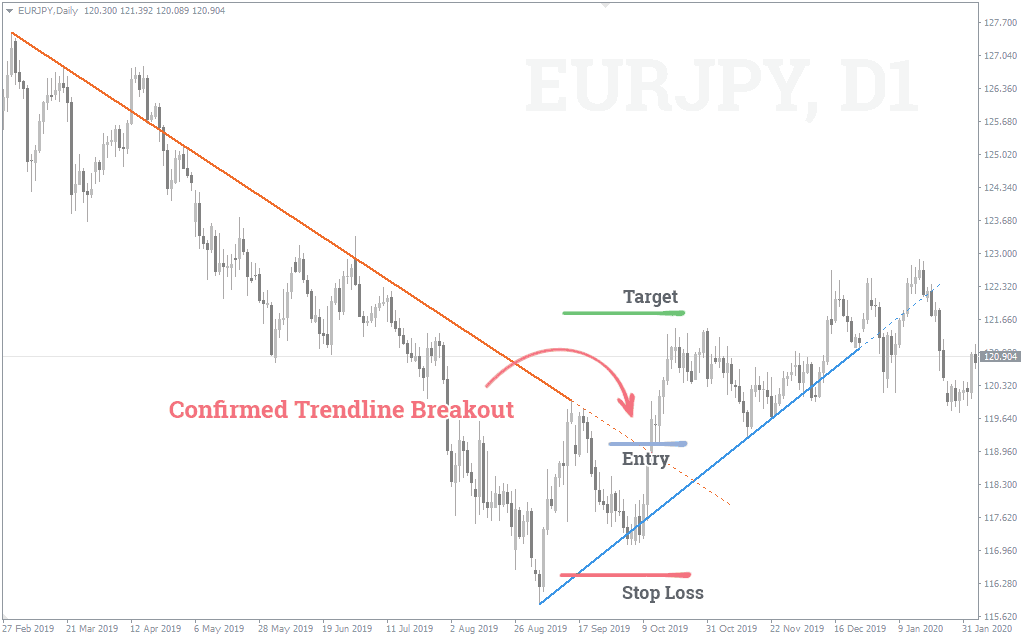
EUR/JPY trade example:
In this trade setup on the EUR/JPY daily chart, you can see that we followed each of the steps outlined above.
We identified a bearish trendline, took a long position when the trendline was broken and rode the momentum in the move higher.
You can also see that the FXSSI Auto TrendLine indicator printed a bullish trendline in blue, supporting the idea that the trend was changing and a breakout was imminent.
All these little things help.
Trendline Reversal Strategy
The second trendline trading strategy that you can implement is the reversal strategy.
Reversal trading is a safe trading strategy. Support and resistance levels are in play, until they are broken. For this reason, many traders like to trust them by trading reversals rather than breakouts.
Once again, the trend is your friend. Only look to buy while the market is in a bullish trend and look to sell while in a bearish trend.
In the following example, we’re going to be trading in the opposite direction to the first strategy, this time looking to sell.
Steps to follow when taking a short position:
- Identify a bearish trendline on your chart in red.
- When a trendline bounce occurs, take a short position.
Place your stop loss above the previous swing high and once again target a risk: reward ratio that works for you.
Remember, you can follow the steps in the opposite direction when taking a long position.
AUD/USD trade example:
In this particular AUD/USD daily trade setup, once again each of the steps above have been followed.
A bearish trendline was printed, we took a short position when price looked to hold the level and we allowed the trend to continue to carry price lower.
You can see that on the last touch that the trendline indicator used to draw the line, price printed an inverted hammer. Just another supporting price action indicator that points out that a reversal at resistance is imminent.
Use whatever works for you as additional confirmation.
Final Thoughts on Choosing a Trendline Strategy
When choosing a trendline trading strategy, success will depend on your personality as a Forex trader.
If you’re an aggressive trader then maybe you’re best suited to trading trendline breakouts because they allow you to get on board at the very start of market movements.
However, if you’re more of a conservative trader, who is looking to take small chunks from within the middle of moves, then maybe a reversal strategy is best for you.
Whichever trendline trading strategy suits you best, just make sure you always apply good risk management principles and there's no doubt you’ll be rewarded with extended market moves.


