A Step by Step Guide to Confirm Breakouts
Breakouts are frequent in Forex, but not all of them are true. However, there's a way to confirm a breakout. Today we'll be looking at four breakout confirmation methods, and we're going to practice them on an actual Forex chart.

So, if you don't want to experience false breakouts riddled with bull and bear traps and fall for them, dive into the four ways to confirm breakouts in Forex.
Without further ado, how do you confirm breakouts in Forex?
Use the Price Action
This first method for confirming a breakout on your chart requires some patience. It involves the use of price actions, such as forex candlesticks, to confirm the breakouts.
For a proper breakout, the body of the breakout candle must cross the support or resistance level and close outside of this level. It takes two candlesticks sometimes. One stops at the middle of the breakout level and the second completes the breakout. Note that the bodies of the candlestick are what we must consider, not the wicks.
The first thing to do when using a candlestick to confirm a breakout is to wait for the full formation of the potential breakout candlestick. That is where patience comes into play.
When using this method to confirm your breakout, you must wait until the candlestick closes, even when the candlestick is shooting out of the support or resistance level before the close. There’s no way to be sure that the breakout is false or true until the candlestick closes.
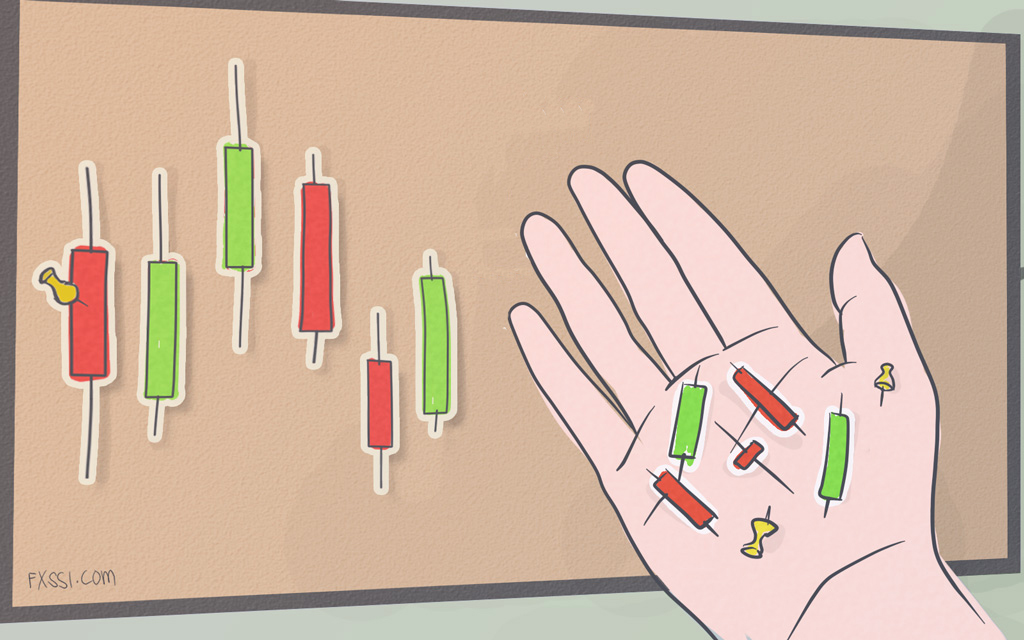
The thing about the false breakouts is that they are often in stop-loss hunts. In other words, they hit the stop losses of traders before returning into the potential breakout level.
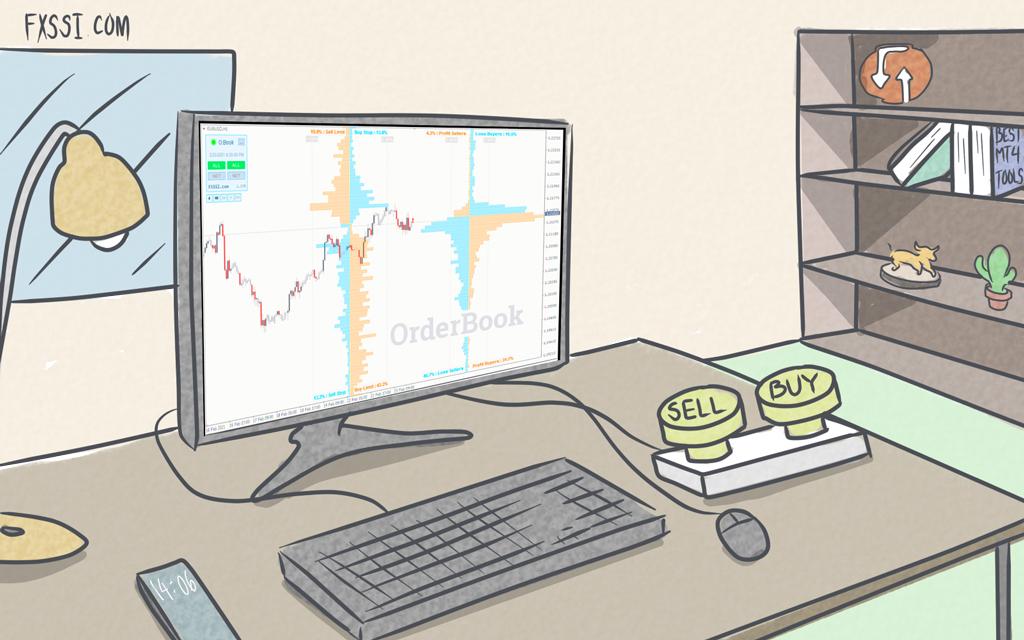
Fortunately, the Stop Loss Clusters indicator for MT4 is perfect for such situations. It shows you where most traders have placed their stop losses, as in the image below.
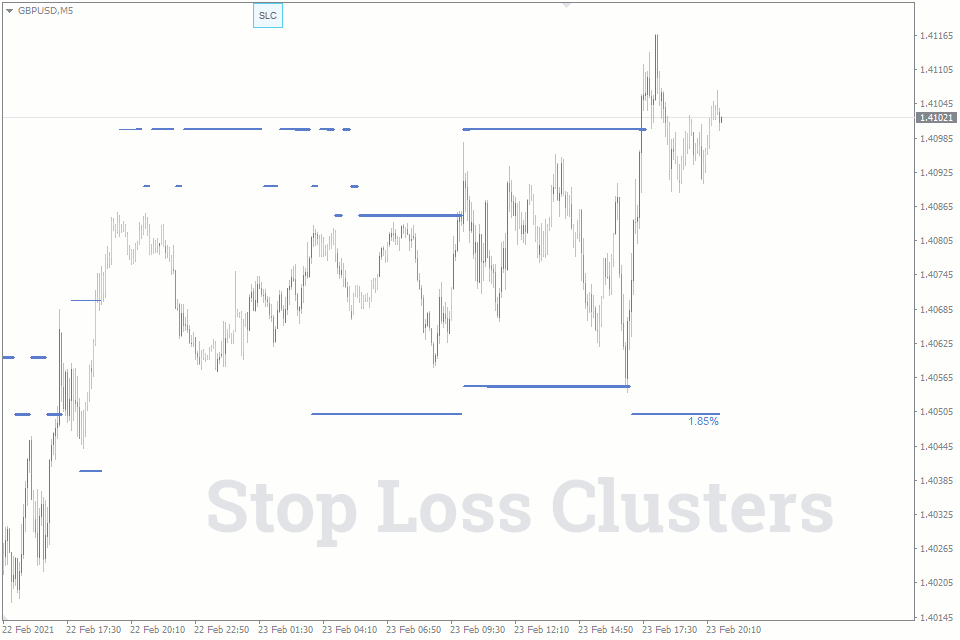
So, if your breakout candlestick doesn’t retrace after hitting the stop loss cluster, it may be that the breakout is true.
The Breakout and Retest Strategy
Another way to confirm a breakout is to use the breakout and retest strategy. Often after the breakout candlestick, the price retests the level it broke out from. This pullback holds the key to confirming a breakout.
After the price completes its pullback to the level, it then retraces its steps. This time, in the direction of the breakout. A breakout is confirmed once the price returns to the highest (for a bullish breakout) or lowest (for a bearish breakout) level after the breakout but before the pullback.
Now, you may ask yourself why you would still need another tool to confirm a breakout after the breakout candlestick has obviously confirmed the breakout. The answer to that is that a false breakout can still occur despite a strong breakout candlestick.
In the image above, for instance, the price returns inside the level it had just broken out of right after the breakout candlestick. Anyone who had opened a buy/sell position based on the breakout candlestick alone would have lost that trade.
Use Indicators
Indicators also offer ways to confirm breakouts. Volume and momentum indicators are two types of indicators that can be used for trend confirmation.
When you notice a breakout occurring, pull up a volume indicator like the Better Volume indicator and see if there’s enough volume behind this breakout. A breakout without enough volume may mean there isn’t enough force to push the price past the resistance or support level. Most times, these lead to false breakouts.
Using the Bigger Picture
Before you trade that breakout, ask yourself how that breakout is going to fit into a bigger picture. For instance, before making a breakout trade based on your analysis on an hourly chart, look at the 4-hour chart and see how your hourly breakout looks on it.
This confirmation method requires experience in analyzing the charts. The reason is that you must try to understand other forex terms, like pullbacks and corrections, minor and major trends, chart patterns, and so on. It is with these tools that you can better understand how your breakout fits into the context of the larger timeframe.
Bringing It All Together
When you’re looking to confirm your breakouts, don’t rely on just one of these strategies. Use all of them in confluence instead.
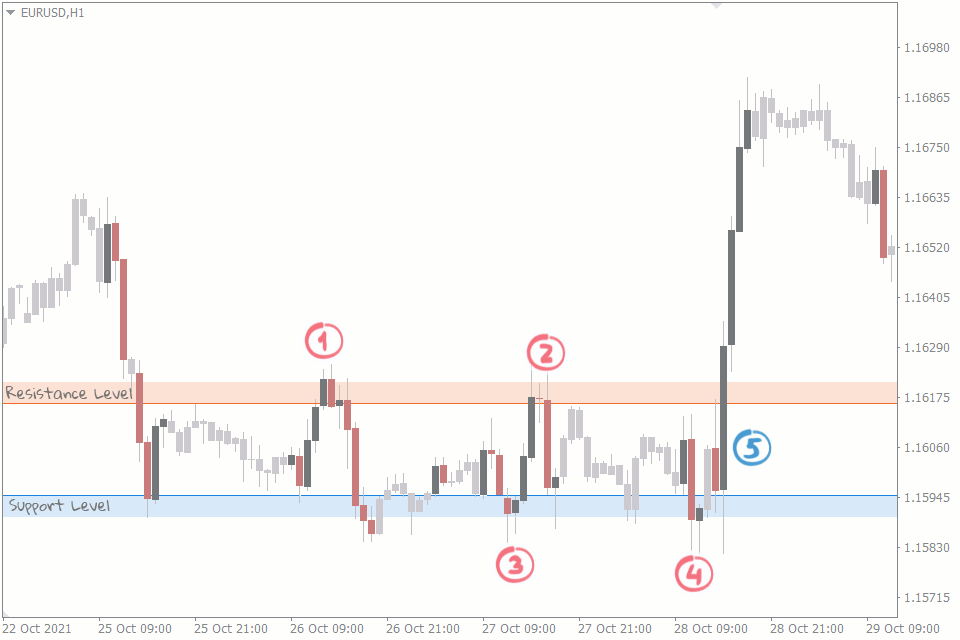
We’ll use the EURUSD chart below to illustrate everything we’ve discussed up to this point. A breakout recently happened on the hourly chart of the currency pair. Here’s how we confirmed it:
We first drew our support and resistance levels
This is pretty straightforward.
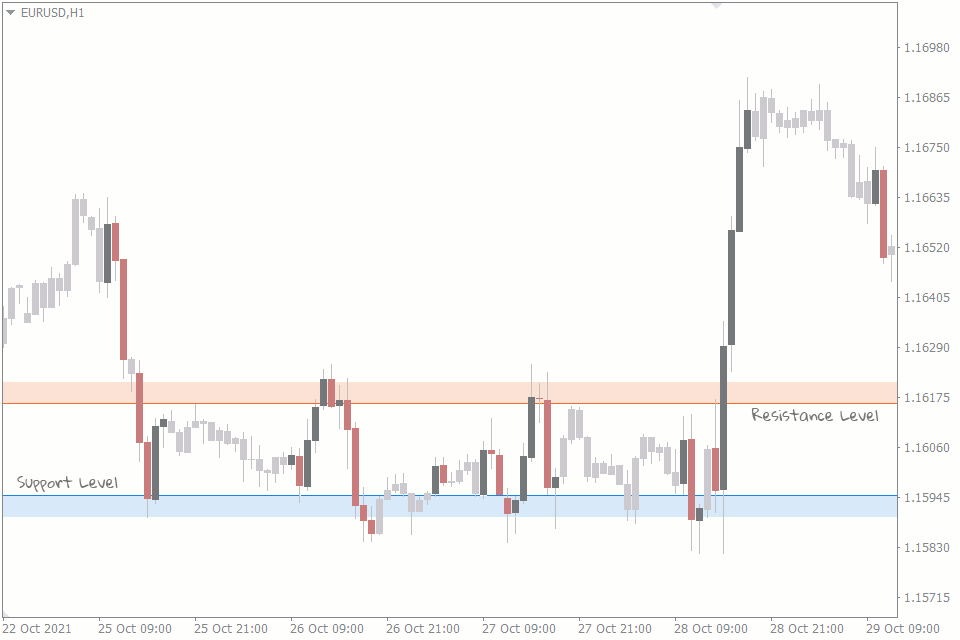
If you’re having trouble, we have an article that describes how to define support and resistance levels. You can also use the Support and Resistance indicator.
The first breakout attempt
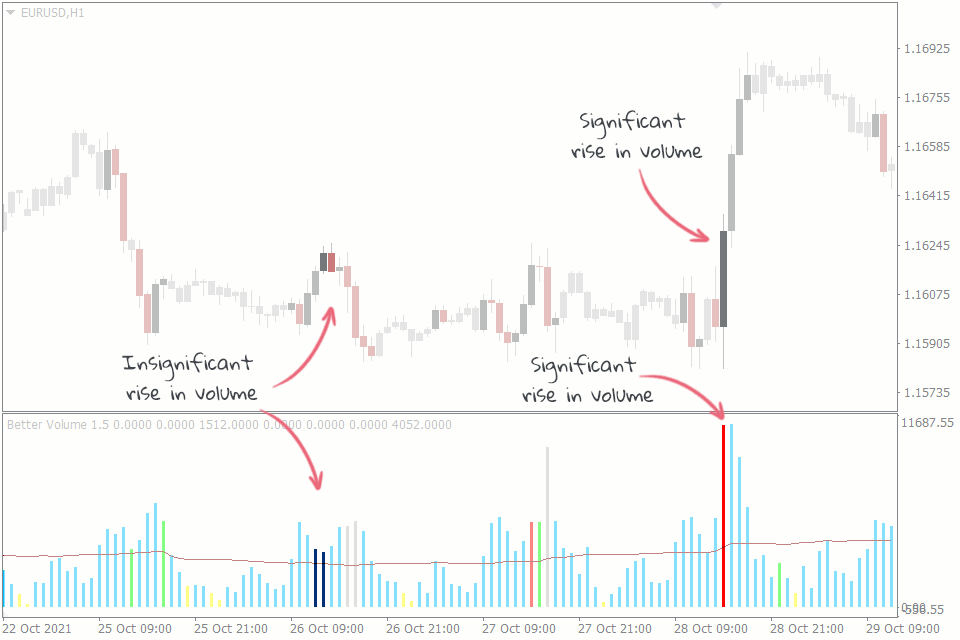
Two candlesticks attempted to breakout of the resistance level. But when you look at Better Volume indicator, there isn’t a significant increase in volume to fuel the breakout. This is the first negative signal.
The second negative is that the price immediately attempts a retest but fails and falls back within the resistance level.
Already two negative signals. The breakout is false.
Other breakout attempts
Other breakout attempts don’t even count because the bodies of their breakout candlesticks never made it out of the support and resistance levels.
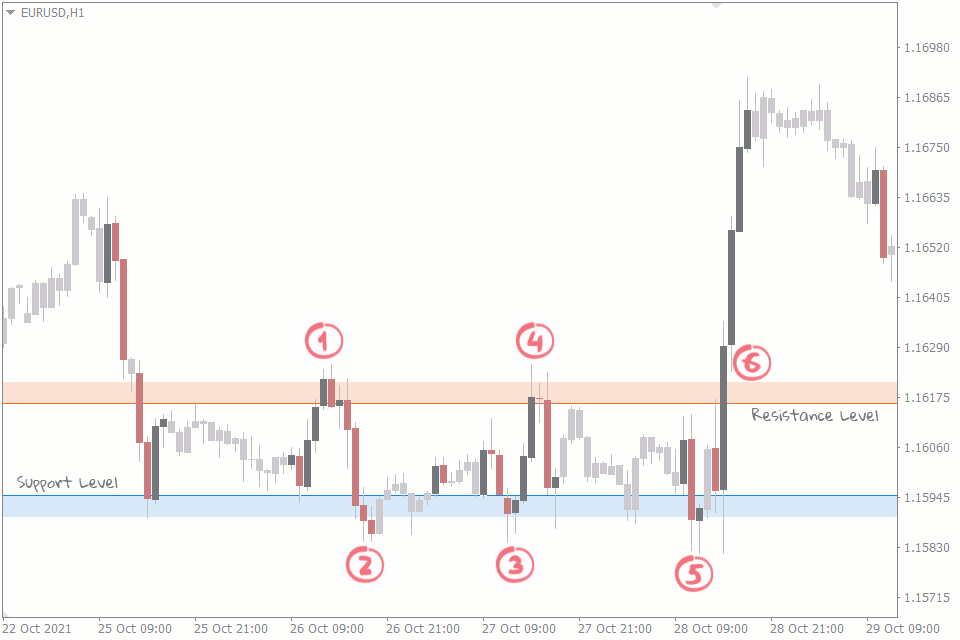
A novice trader could have traded a breakout before the close of these potential breakout candles, and they would have been wrong.
The final breakout attempt
On this last breakout attempt, the breakout candlestick is what we want. It breaks out of the resistance level cleanly. This is the first positive signal.
The second positive signal is that there is a significant increase in the volume. This means there is enough volume to fuel the resistance level.
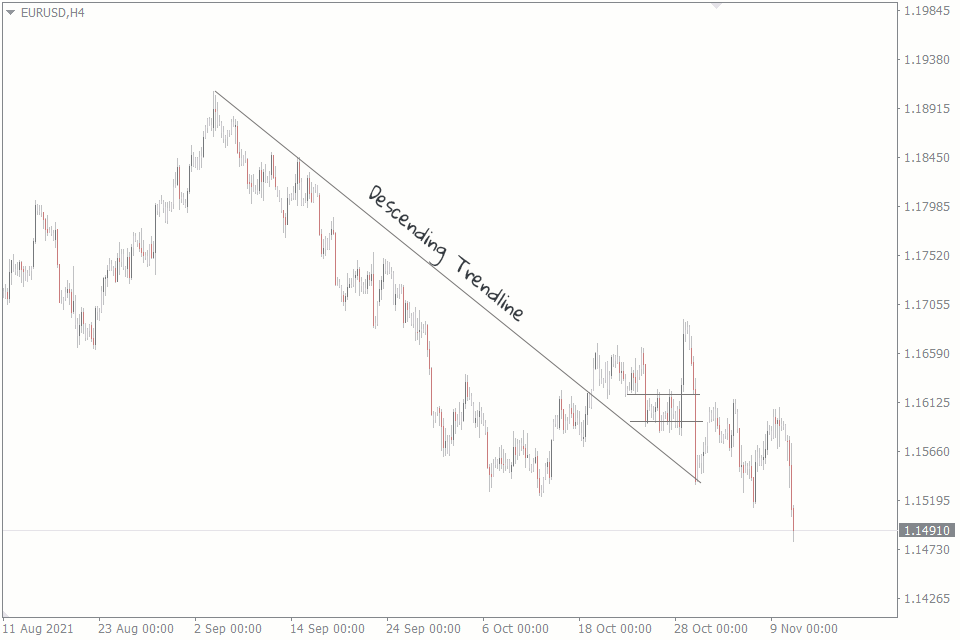
The third positive signal is in the bigger picture. On the 4-hour chart, you’ll notice a huge downtrend to the left. A correction was bound to happen. The price finally broke out of the descending trendline and a reversal, minor or major, is impending. Our breakout coincides with the trend reversal.
Although the retracement has not happened, these three positives help us confirm the breakout.
That is how you confirm a breakout in your forex trading.
Conclusion
There you have it. 4 ways to confirm a breakout to keep you from falling for those bull and bear traps.