5 Powerful Candlestick Patterns to Use in Your Forex Trading
The Forex market always moves in patterns. This makes sense when you consider how price has and will only move in one of two directions: up or down.


So, there usually aren’t new things happening in the Forex market. And if you look closely, you’ll notice shapes and patterns on the charts and the candlesticks. This article is about some of the best candle patterns.
Many traders try to use these candlestick patterns to understand the Forex market. The patterns are so important to the traders that these formations make up cogent parts of their trading strategies.
Here are some of these patterns and what they mean when they show up on the Forex market.
Bullish and Bearish Engulfing Candlestick Patterns
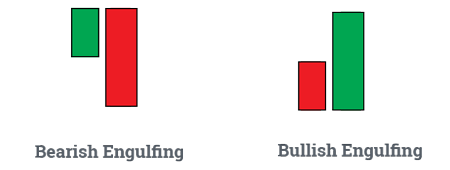
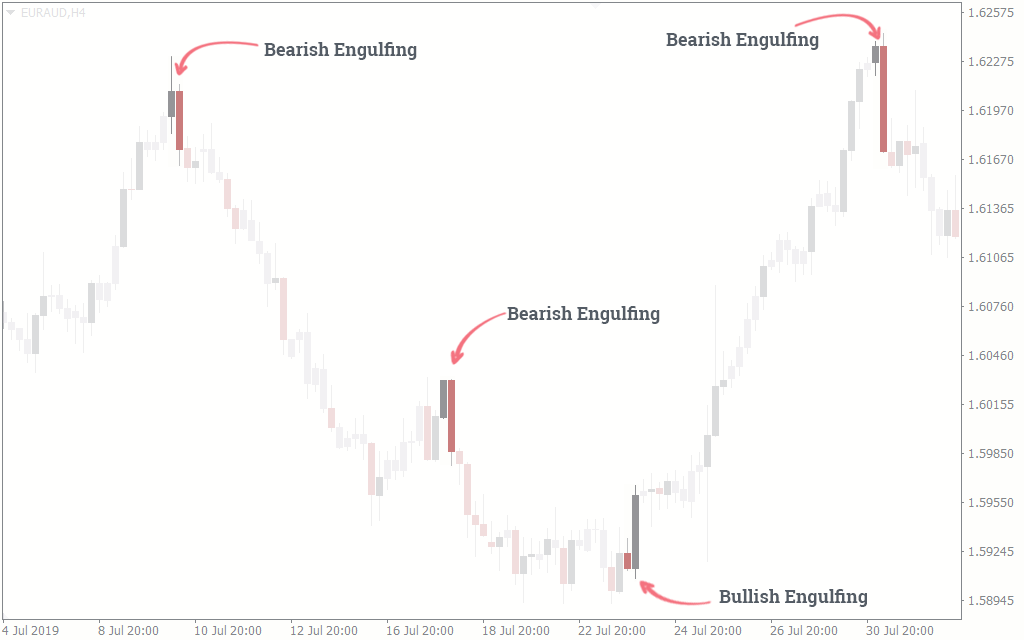
Engulfing candlestick patterns form when small candles are followed by big, opposing candles. A bullish engulfing candlestick pattern, for instance, occurs when a weak bearish candle comes before a strong bullish candle.
Similarly, a bearish engulfing candlestick formation starts with a weak bullish candle and ends with a bearish candle that engulfs it in size.
When engulfing candlestick patterns form, they show that the price is ready to make a trend reversal and has the momentum to keep it up temporarily.
That’s why the stronger candle comes after a weaker one. Since these candlestick patterns suggest reversals, you would usually find them at the top or bottom of trends.
Although the resulting trend from the reversal may not be strong enough to form a major trend, the momentum behind the engulfing candle is often enough to drive a minor trend or, at least, last for a few pips.
The Evening And Morning Star Candlestick Patterns
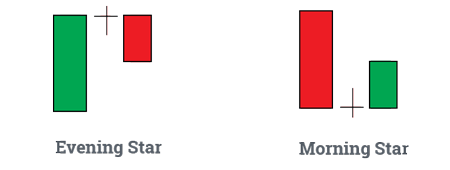
The evening star and morning star are two of the most common candlestick patterns in Forex to trade reversals. They start with a candle in the direction of a trend.
A small candle with a small body follows, before a strong candle in the direction opposite to the previous trend occurs.
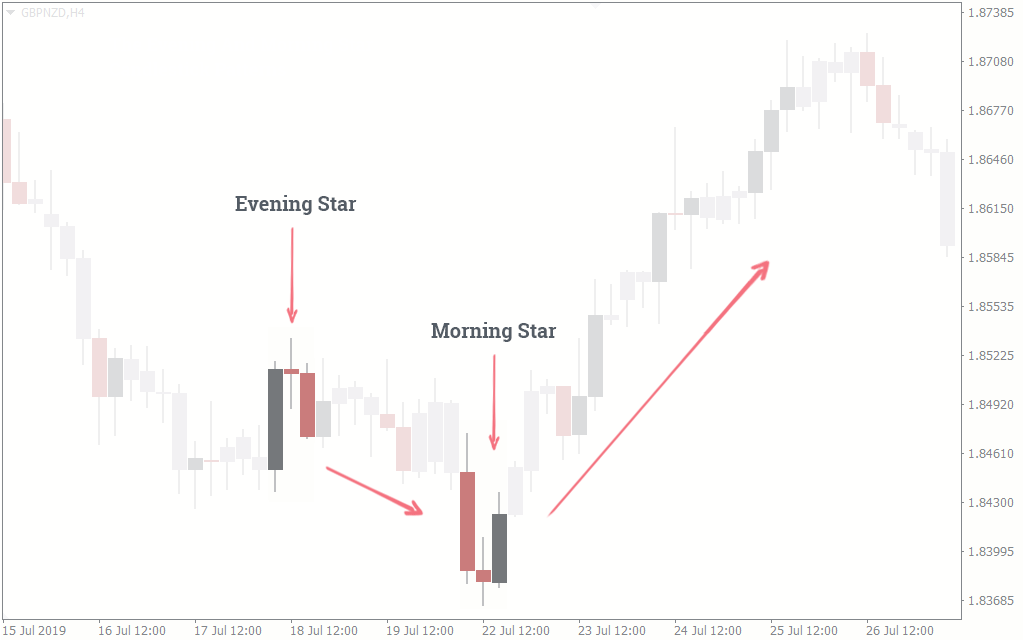
The evening star candlestick pattern occurs at the top of a trend to suggest a reversal to the downtrend. The morning star, on the other hand, happens at the bottom of a trend to suggest a reversal to the uptrend.
The small middle candle is the key to understanding why the evening star or morning star patterns suggest reversals. It shows that the market is temporarily hesitant about its next direction, whether uptrend or downtrend.
But when there is a stronger candle in the direction opposite to the previous trend, that is often a sign that the market has decided, and a reversal is its decision.
The Three Black Crows And The Three White Soldiers
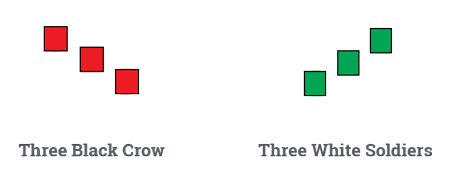
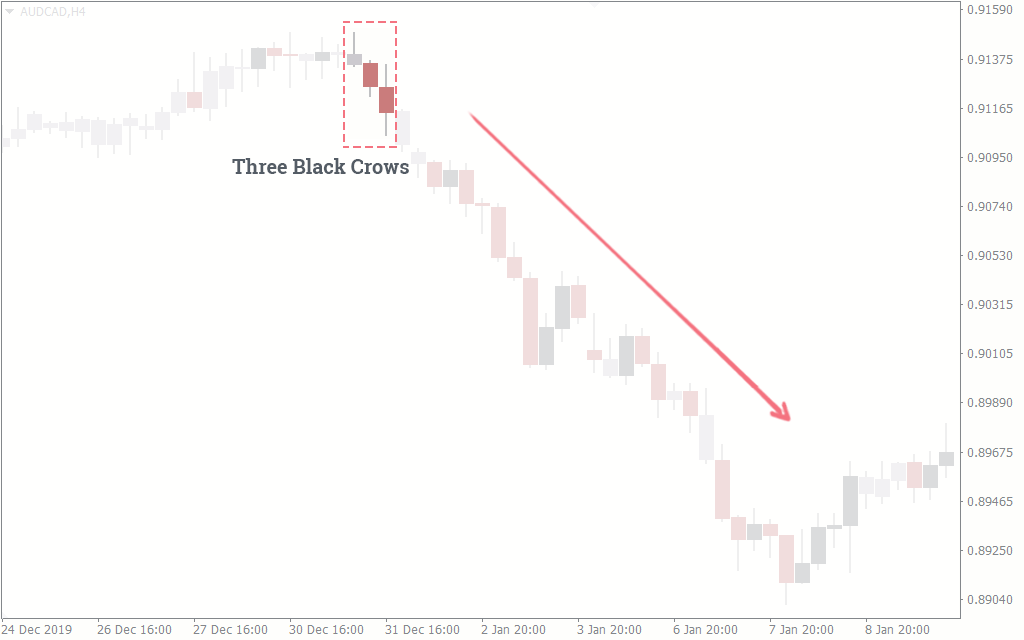
Three consecutively strong bearish candles are known as the three black crows candlestick pattern. Replace the bearish candles with bullish, and you have three white soldiers.
These crows and soldiers are two of the best candle patterns Forex traders keep in their trading arsenal.
The three black crows and their bullish counterparts, the three white soldiers, often have two tasks: they either suggest a trend continuation or trend reversals, depending on their position on the chart.
When any of these happen in the direction of a prevailing trend, they are strong markers of continuation. But when they appear in the opposite direction to the previous trend and close to the end of that trend, a reversal may be looming. In many cases, they are the markers of strong reversals.
The Railroad Tracks Candlestick Patterns
Like many other candlestick patterns that come in twos or threes, railroad tracks suggest reversals.
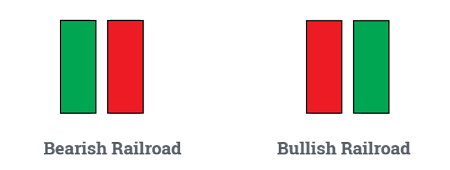
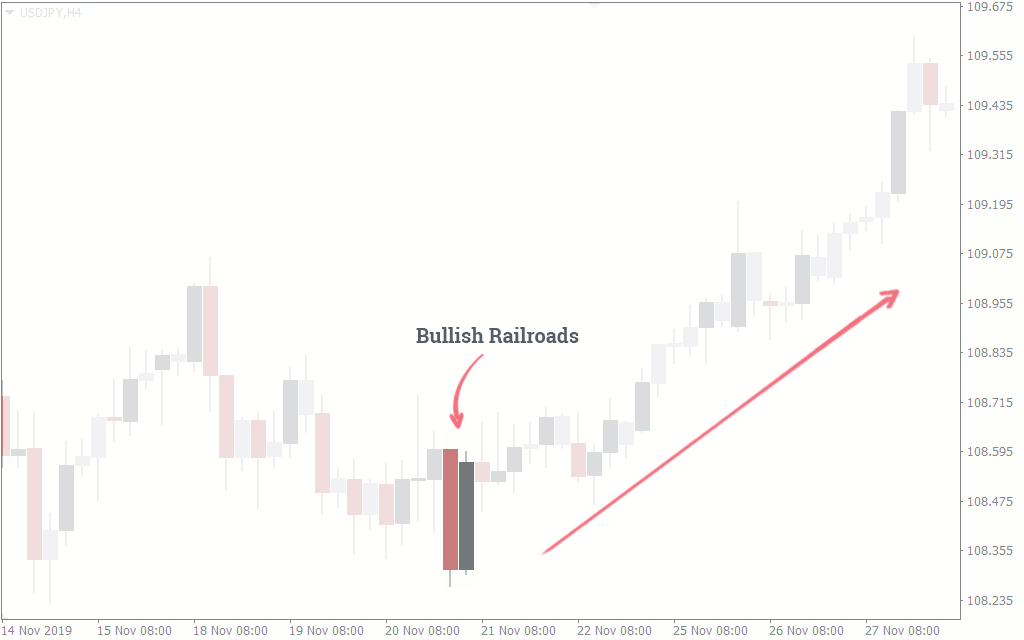
Railroad tracks are very easy to spot on the Forex charts, as they are represented by equally strong but opposing candlesticks (often with little or no wicks) sitting next to each other.
A bullish railroad track pattern, for instance, starts with a bearish candle and ends with a bullish. On the other hand, a bearish railroad track pattern starts with a bullish candle and ends with a bearish.
An interpretation of the railroad tracks candlestick pattern is that price is matching the momentum of the previous strong candle but in the opposite direction.
The Doji Candlestick Pattern
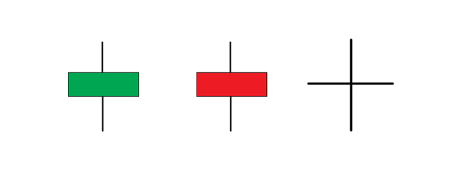
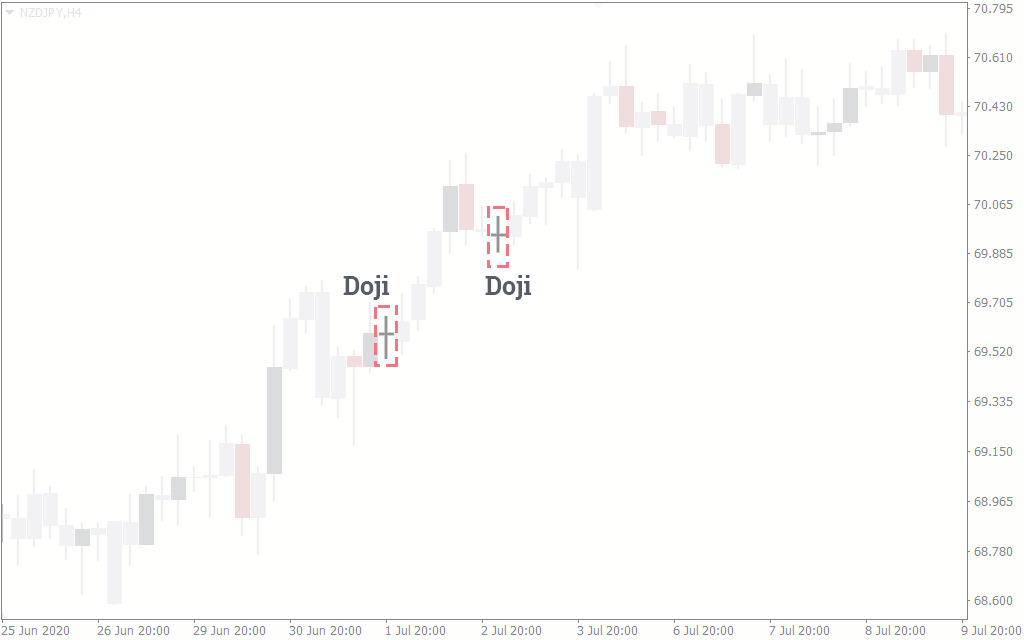
There are times when the Forex candlestick is neither bullish nor bearish. Instead, it is a candlestick with short wicks and a negligible body. It takes the shape of a “plus” sign. The candlestick formed is called the Doji.
The Doji occurs in the charts when the market is temporarily undecided as to the next direction to go, whether up or down. In other words, it is neutral and cannot be used to trade a reversal or a continuation.
Then, what makes this unbiased candlestick powerful?
The positioning of the Doji is where its power lies. You could find a Doji almost anywhere on the charts, and every single position says something important about the currency pair.
For instance, wherever the Doji appears, know that the market could make a reversal or trend continuation on the next few candles.
When the candles preceding and following the Doji are opposing, the three candles (including the Doji) could sometimes make up an evening or morning star formation. This means a reversal is likely to come soon.
When two or more Dojis come one after the other, it could be a sign that price has lost its momentum.
Wait! Before You Trade The Candlesticks Patterns…
Here are some things you should bear in mind:
- Don’t wait for the perfect formations of these candlestick patterns before you trade them. Most of the time, they appear a little lopsided and could confuse you. However, the more you try to find them when you backtest, the better you get at sighting them on a live market.
- Don’t expect massive price movements after the candlestick patterns. Sometimes, a candlestick pattern is followed by a single candlestick in the direction the pattern suggests. Because of this, don’t use the candlestick patterns in isolation, especially if you are not an expert in trading with them.
Instead, combine them with other forex trading tools and structures before you make a trade. For instance, you could use the railroad track pattern with this auto trendline indicator to trade minor reversals within a major trend.
- Another thing worth mentioning is that candlestick patterns may not always tell the whole story. Sometimes, you have to consider the recent price action of the currency pair using the previous candles before you make an overall decision to buy or sell.
Conclusion
It is hard to say these candlestick patterns are the best for Forex trading, as there are many more powerful candlestick patterns, and your preferences count. However, these are the most common candlestick patterns many Forex traders use in their trades.
Let’s end this article with this: If the Forex charts told the stories of every currency pair, candles would be the words, and candlestick patterns would be sentences.
And each sentence gives every currency pair its meaning. It is left to you, the trader, to try to deduce what stories the sentences tell and try to make profitable trades from them.

