Candlestick Patterns in Forex and What do They Mean
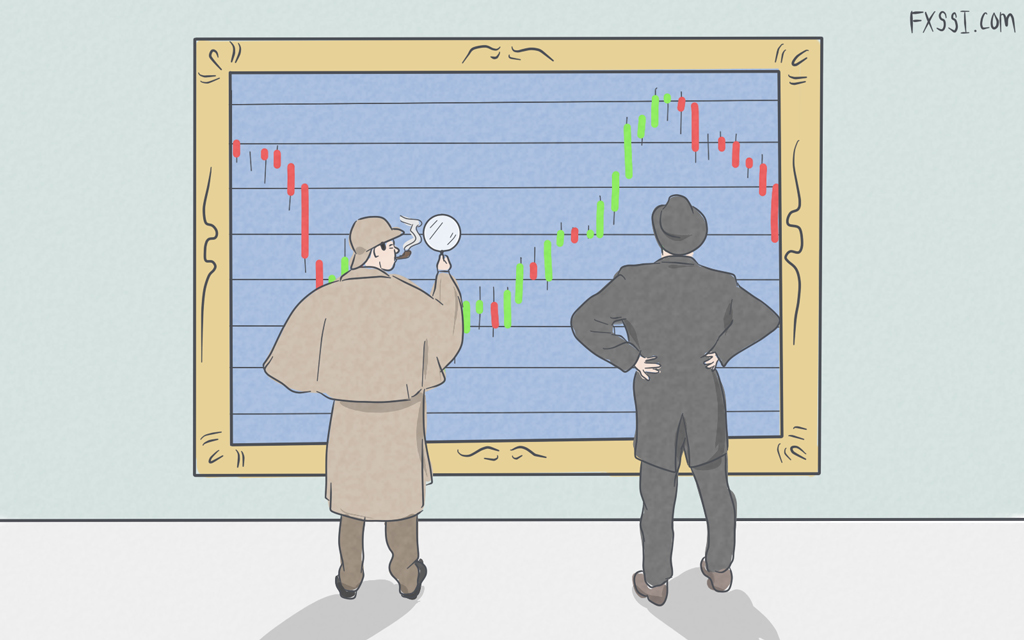
Japanese candlesticks often form patterns that predict future price movements. Some of them predict bullish price movements, and others suggest bearish price movements. They may appear as single, two, or three candlestick patterns.

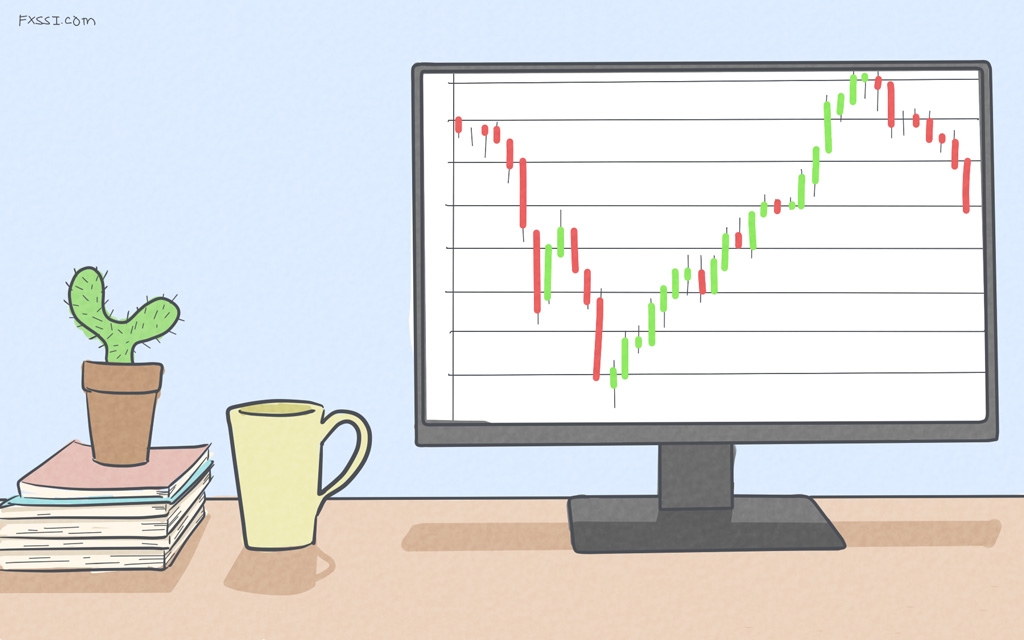
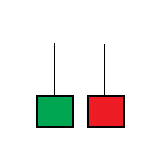
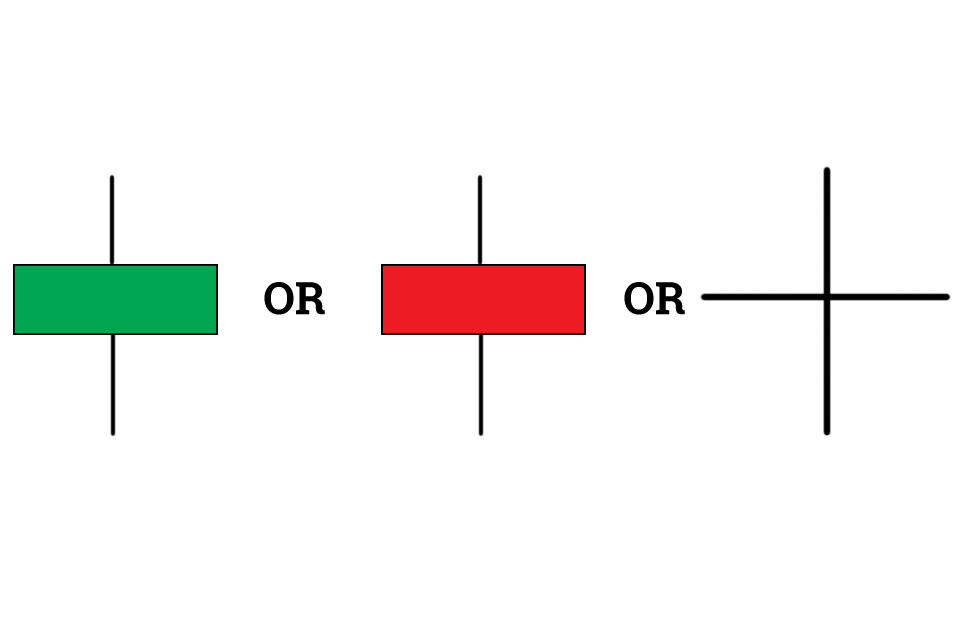
Forex candlesticks originated from Japan a very long time ago, and they have become popular since then. What makes them the preferred chart type for many Forex traders is that every single candlestick contains information about the opening price, closing price, the highest price point, and the lowest price point for every given period.
Here are the most common candlestick chart patterns in Forex: Bullish Candlestick and Bearish Candlestick (with images).
All Bullish Candlestick Patterns
There are eight common Forex bullish candlestick patterns. All these patterns either suggest the beginning of a new uptrend or a continuation of a major uptrend.
This is a list of all the bullish candlestick patterns in Forex:
| Candlestick Pattern | Name | Description |
|---|---|---|
 |
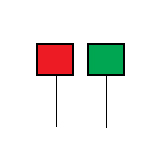
Bullish Exhaustion/ Hammer | A candlestick that has a long wick underneath it with a tiny body at the top. This candlestick could either be bullish or bearish. What marks it out as a bullish candlestick pattern is its small body sitting on a long wick. |
 |
Bullish Engulfing | Made up of two candlesticks – a bearish followed by a bullish one. It is called bullish engulfing because the size of the bullish candle completely engulfs the bearish one preceding it. |
 |
Bullish Railroad | Made up of two candlesticks of almost equal sizes – a bearish followed by a bullish. When they follow each other, it is often a sign that the market is taking a sharp turn towards the uptrend. |
 |
Bullish Marubozu | A long bullish candlestick with no wicks (or negligible wicks) that suggests an uptrend continuation. |
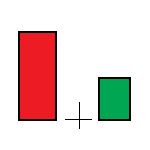 |
Morning Star | Made up of three candlesticks. The first candlestick is bearish. The second one is a small candle with a negligible body and very little wicks. It looks more like a “plus” sign. The third one is a bullish candlestick that suggests a turnaround in the market bias. The bullish candlestick doesn’t always have to be as big as the first bearish candle. |
 |
Three White Soldiers | Made up of three bullish candlesticks with little or no wicks. This often suggests a bullish continuation. |
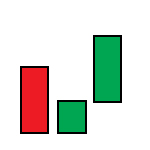 |
Three Inside Up Harami | Made up of three candlesticks – a bearish followed by two bullish ones. The first bullish candlestick after the bearish one is small compared to the previous bearish candlestick. But the next bullish candlestick engulfs the bearish one suggesting the market is making a strong move towards the uptrend. |
 |
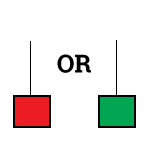
Bullish Tweezers | Tweezers are almost similar to exhaustion candlesticks, except that bullish tweezers come in twos and often have shorter wicks. A bearish candlestick comes first, and it’s followed by a bullish one. |
All Bearish Candlestick Patterns
Bearish candlestick patterns in Forex are the direct opposites of their bullish counterparts. They suggest a continuation of a major downtrend or the beginning of a new downtrend.
These are the most common types of bearish candlestick patterns in Forex:
| Candlestick Pattern | Name | Description |
|---|---|---|
 |
Bearish Exhaustion/Shooting Star | A candlestick that has a long wick above it with a tiny body underneath. This candlestick could either be bullish or bearish. What marks it out as a bearish candlestick pattern is a small body underneath a long wick. |
 |
Bearish Engulfing | Made up of two candlesticks – a bullish followed by a bearish one. It is called bearish engulfing because the size of the bearish candle completely engulfs the bullish one preceding it. |
 |
Bearish Railroad | Made up of two candlesticks of almost equal sizes – a bullish followed by a bearish. When they follow each other, it is often a sign that the market is taking a sharp turn towards the downtrend. |
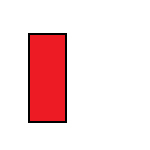 |
Bearish Marubozu | A long bearish candlestick with no wicks (or negligible wicks) that suggests a downtrend continuation. |
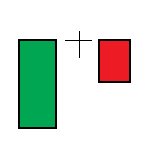 |
Evening Star | Made up of three candlesticks. The first candlestick is bullish. The second one is a little candle without a body and very little wicks. It looks more like a “plus” sign. The third one is a bearish candle that suggests a turnaround in the market bias. The bearish candlestick doesn’t always have to be as big as the first bullish candle. |
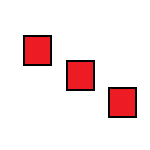 |
Three Black Crows | Made up of three bearish candlesticks with little or no wicks. This often suggests a bearish continuation. |
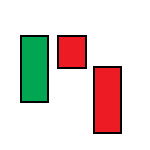 |
Three Inside Down Harami | Made up of three candlesticks, a bullish followed by two bearish ones. The first bearish candlestick after the bullish one is small compared to the previous bullish candlestick. But the next bearish one engulfs the bullish candlestick to suggest the market is making a move towards the downtrend. |
 |
Bearish Tweezers | Bearish tweezers are almost similar to bearish exhaustion candlesticks, except that bearish tweezers come in twos and often have shorter wicks. A bullish candlestick comes first, and it‘s followed by a bearish one. |
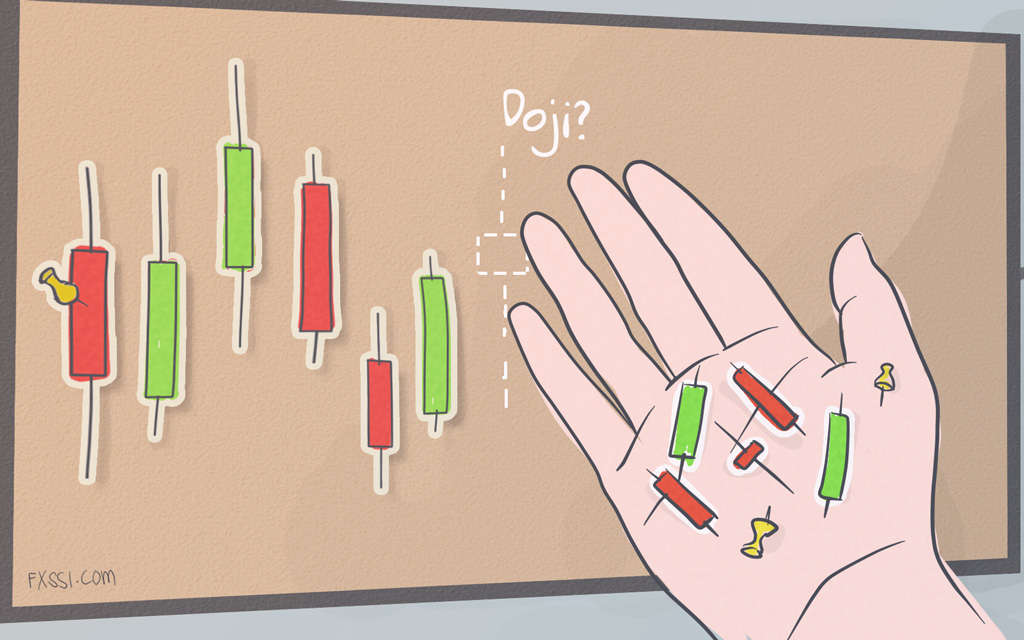
Neutral Candlestick Pattern
The only common neutral candlestick pattern is the Doji. The Doji forms when the market is undecided whether to go up or down. In the end, what forms is a candlestick with a small body and short wicks above and below the body.
A few more words about candlesticks
Because of the way a candlestick is formed, the opening price of a new time period is often close to the closing price of the previous time period. This makes Forex charts look like a continuous flow of candlesticks in trends moving up and down. Trade opportunities abound in these charts.
A common anomaly in the charts is when there is a gap in Forex prices. But even in this case, there are trading opportunities for those who know how to interpret them.
Conclusion
All these candlestick patterns have been there long before the MT4 trading platform made its way into our lives. And till this day, they continue to do a great job of predicting potential price movements.
However, just as it is with many other Forex trading tools or concepts, Forex candlestick patterns are not meant to be used in isolation. You may have to combine them with some other Forex trading tools to get the most out of them.
By the way, if you easily get tired of staring at Forex charts, what you need is this chart overlay indicator that gives your MT4 a fresh, modern look. The indicator also makes your chart look more compact and easier to analyze.