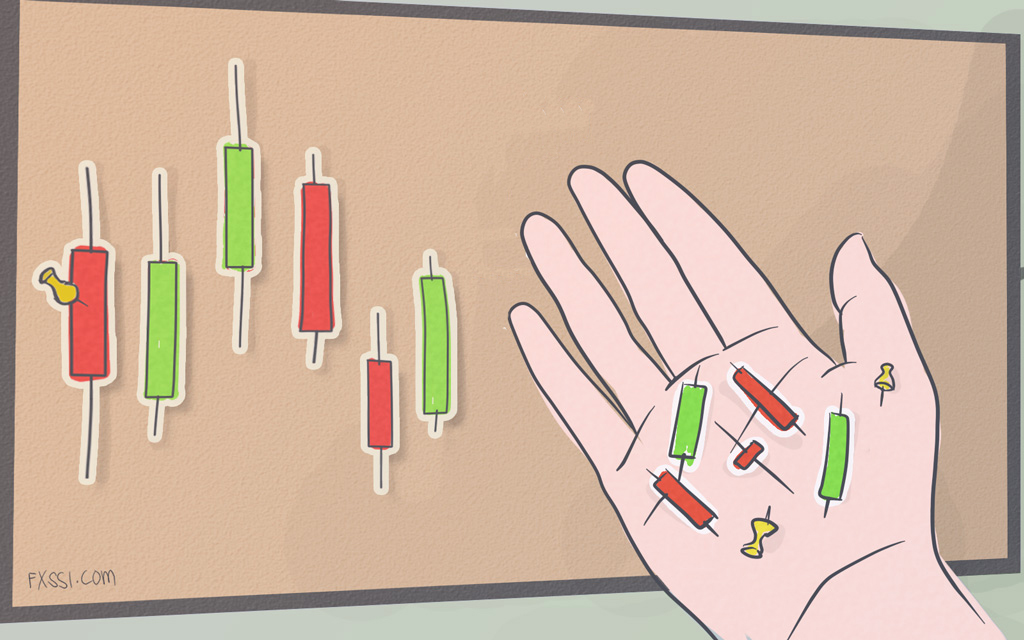
False Breakout - How to Avoid and Even Trade It?
Have you ever seen a key resistance level breached and entered a long position right before the market turns the other way and dumps hard?

Have you watched price smash through support, entered into a short position only to watch the market bounce?
Don’t feel bad, this has happened to everyone – you’re just one of many victims of the false breakout and learning to spot these things can be tricky.
Read on as we discuss breakouts, fakeouts and introduce two powerful indicators from the FXSSI team that can help you stay on the right side of the market and avoid further pain.
Breakout vs Fakeout
So what is a breakout?
What about a false breakout or fakeout?
More importantly, how do we tell the two apart when trading?
Breakouts
A breakout is when the price of an asset breaches a support or resistance level that has previously contained price.
In the case of bullish breakout, the broken resistance level should now act as support and in the case of a bearish breakout, the opposite is true – support should now become resistance.
Once this support or resistance level has been breached and respected, you will often get substantial price continuation in the direction of the breakout.
This isn’t always the case though, sometimes the market has something nasty up its sleeve.
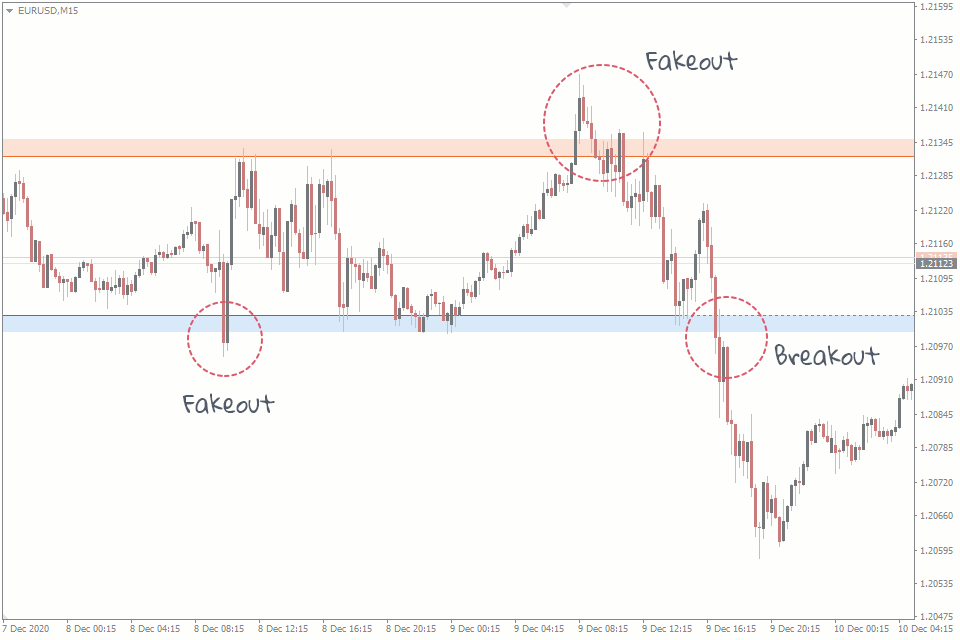
False breakouts – the fakeout
As the name suggests, a false breakout or fakeout is when you get no continuation following a breakout.
It’s often a lot worse than that though, many times the asset you are trading will reverse direction entirely and move decisively against you.
Combined with poor money and risk management practices, fakeouts can be truly devastating to your psyche and account balance.
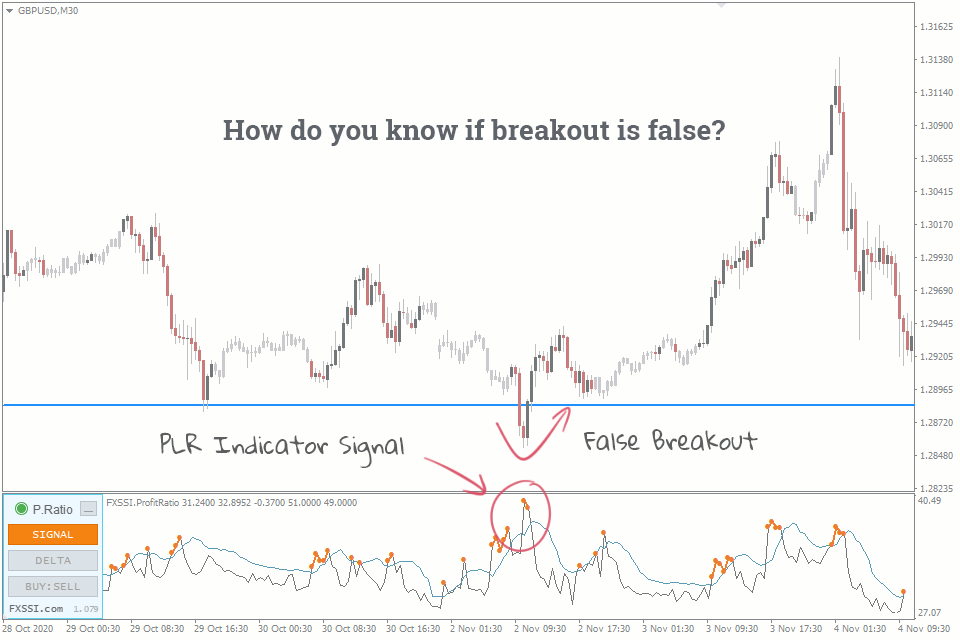
Identifying fakeouts before they happen
It’s all well and good to identify true breakouts and fakeouts after they happen, after all, hindsight is 20/20 and this is even more applicable when it comes to trading and charting.
Identifying whether a breakout has potential or not as it’s actually happening is the real challenge.
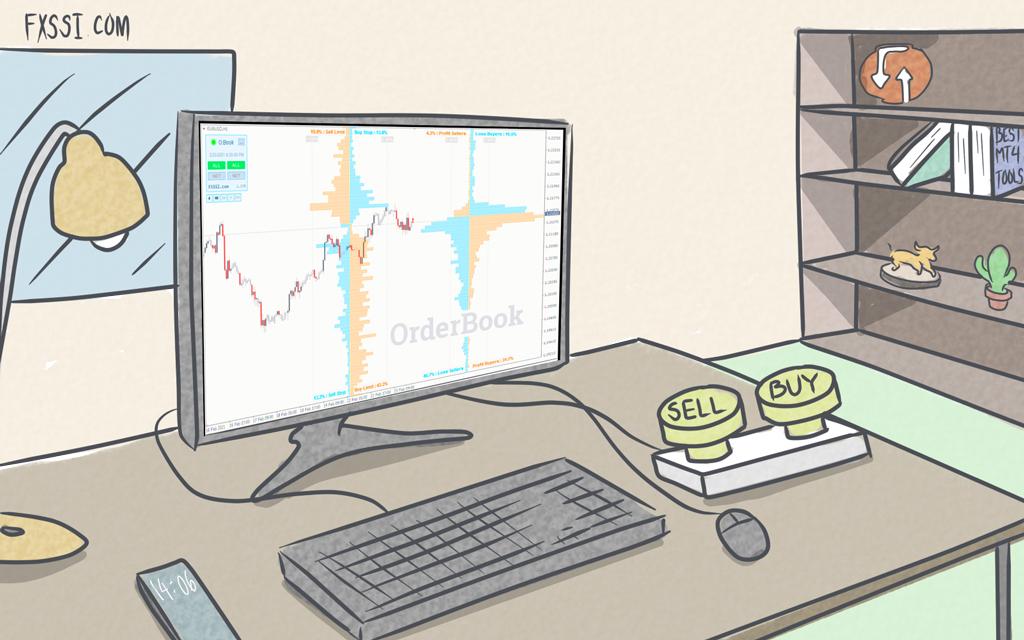
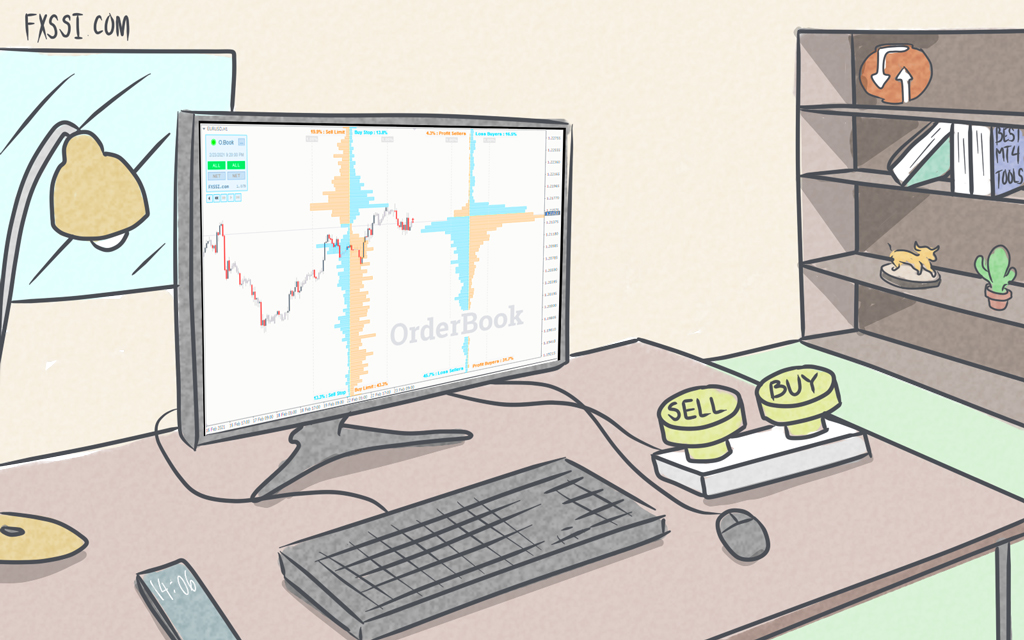
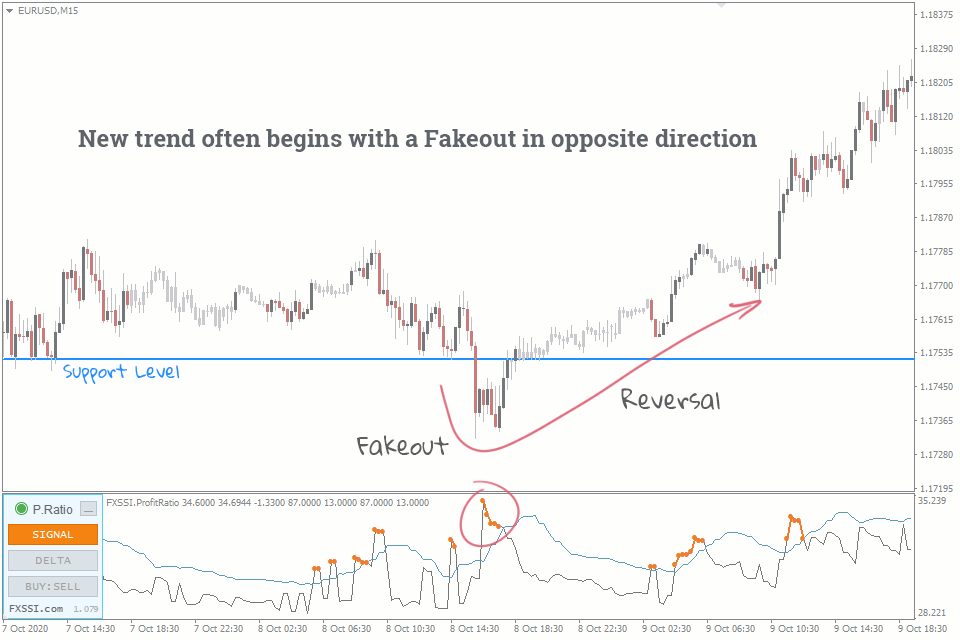
Luckily for you, FXSSI members have access to a great indicator that can help you do just that – the Profit Ratio indicator.
Most traders lose
FXSSI’s Profit Ratio indicator was formulated around the fact that the overwhelming majority of traders lose money.
Combining this knowledge with broker order book data, we’ve developed an indicator that offers powerful insights and trading signals that can often lead to significant market reversals.
The Profit Ratio indicator simply tells you what percentage of traders on our sampled order book are currently in profit.
As we know most traders lose money, if we see an awful lot of traders in profit, chances are their luck is about to run out and a reversal could be imminent.
As the Profit Ratio indicator is a reversal indicator, it is perfect for assessing whether a breakout is indeed real and worthy of a trade, or just a fakeout primed for you to fade.
Avoiding and trading fakeouts
Avoiding and trading fakeouts with the Profit Ratio is very simple, as the indicator highlights potential reversal points on the signal line with an orange dot.
If you see price break through a significant support or resistance level and the indicator is showing an orange dot, it would be wise to stay clear of the breakout.
If the following candle takes price back inside it’s previous range, there is a strong chance you are looking at a fakeout and you can open a position accordingly, trading the potential reversal.
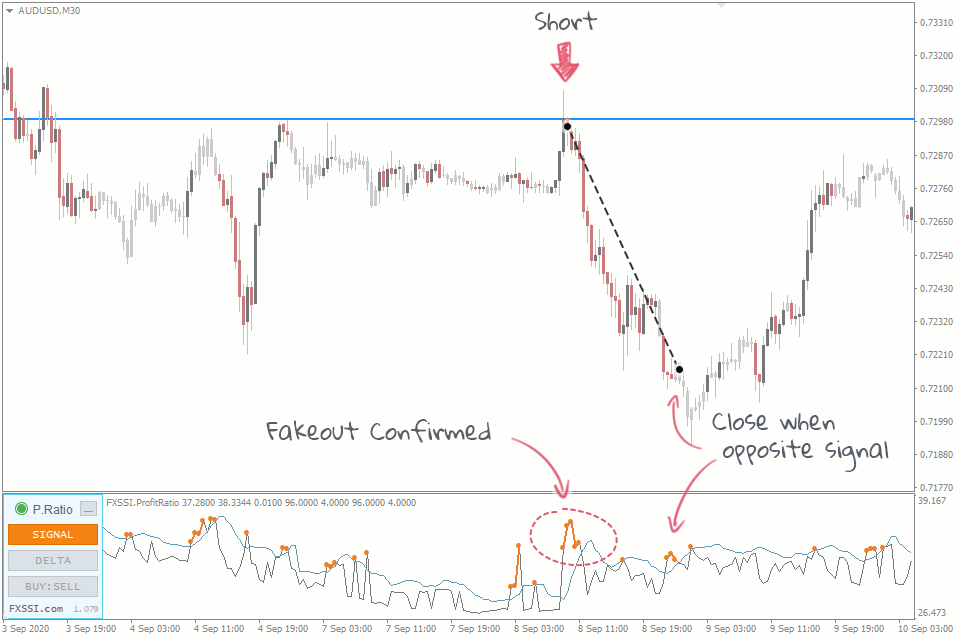
In the example above, the Australian Dollar spikes above the 73 cent mark against the US Dollar as the Profit Ratio indicator is signalling a potential reversal – we do not trade this breakout.
As the following candle respects the previous range, we enter a short position, price then declines more than 1% and we exit on the opposite signal.
Note the blue moving average line on the indicator, reversal signals that occur above this line are more significant, this is why we ignore the first one.
If you want to play it safe, you could use a trailing stop to protect your position if you see one of these weaker signals – this keeps you in the market until a reversal signal occurs above the average, whilst also protecting your profits if the first signal was legitimate.
Stop hunting
Have you ever set your stop loss position right above or below an obvious swing?
What happened?
In a really strong trend you may get away with this, but a lot of the time stops like this will be triggered, only for the market to reverse back in the direction you were trading.
This is known as stop hunting and there is nothing more frustrating.
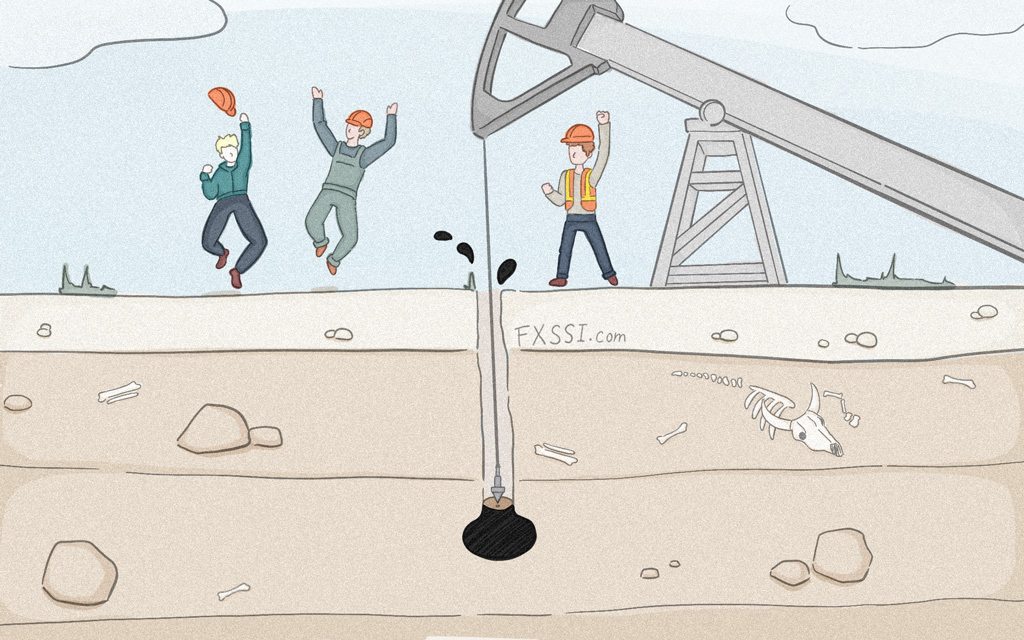
What’s happening here is that larger institutional players require liquidity to enter their large positions, that is if they are looking to buy, they need to buy where there’s lots of people selling.
There’s actually nothing nefarious going on here – stop hunting might be a more accurate term – the big players are simply betting they can get filled where you’re trying to cover your losses.
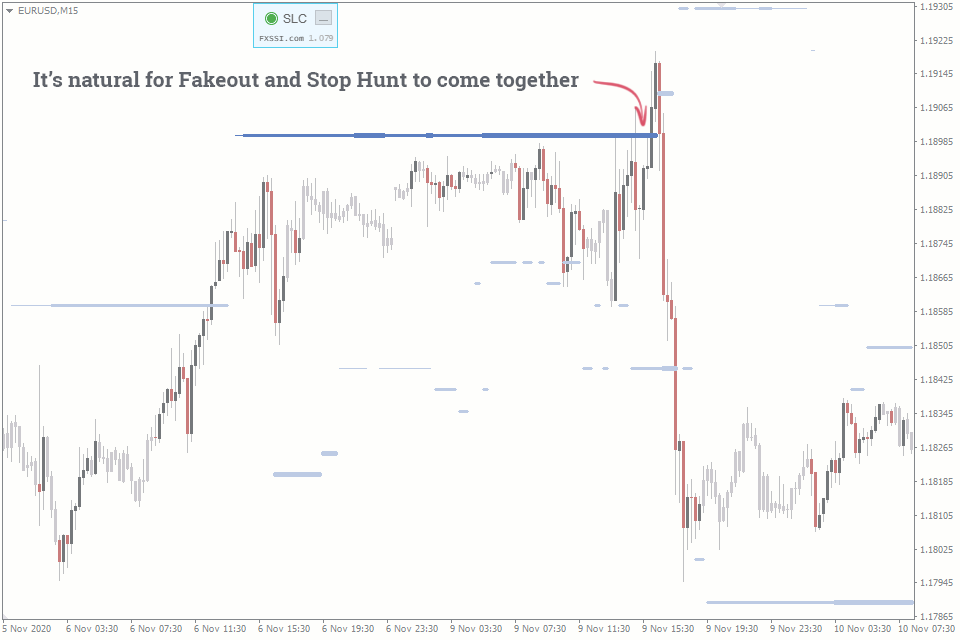
FXSSI’s Stop Loss Cluster indicator is an incredibly useful tool which shows you where other traders are placing their stops – now you can trade like the big guys do!
Fakeouts always trigger stops
If a bullish breakout is driven by stop’s being triggered and not new willing buyers, there’s a good chance that breakout is going to fail.
The same goes for a bearish breakout – if no new sellers are trading the breakout, what will drive price lower?
This is why breakout traders wait to see if price respects the former support or resistance level before trading.
Fakeouts are nearly always accompanied by stop hunting.
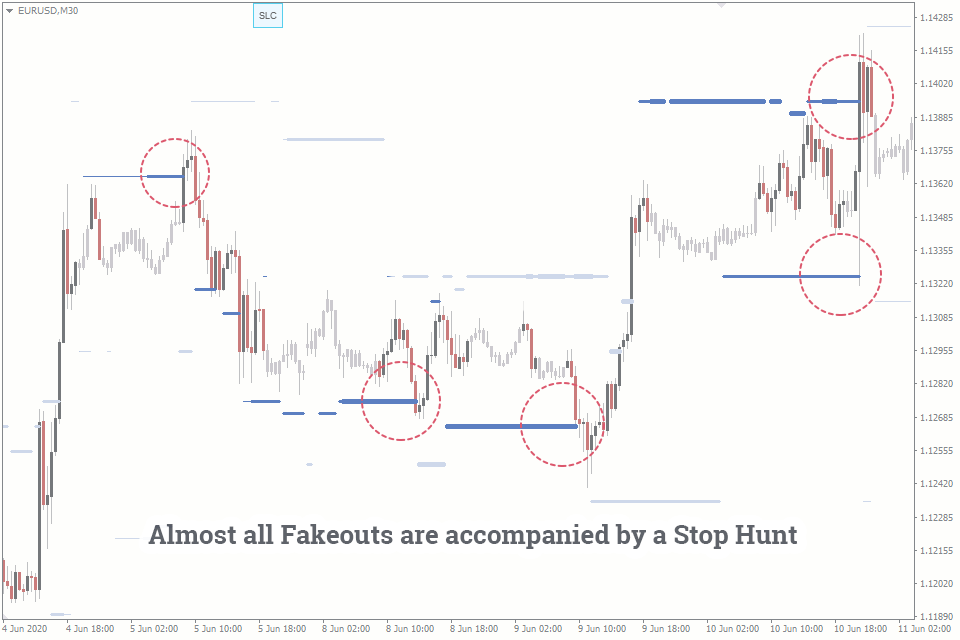
As you can see from the chart above, the stop loss clusters are triggered time and time again, only for price to reverse – that’s a lot of traders leaving money on the table.
As a healthy breakout is usually accompanied by stops being triggered as well, the Stop Loss Cluster indicator is best combined with another indicator like our Profit Ratio indicator.
Trade fakeouts like a pro
Combining FXSSI’s Stop Loss Cluster indicator with our Profit Ratio Indicator can yield some very impressive results.
Both indicators will help to filter low quality signals from the other, helping you avoid bad trades and only take the best opportunities.
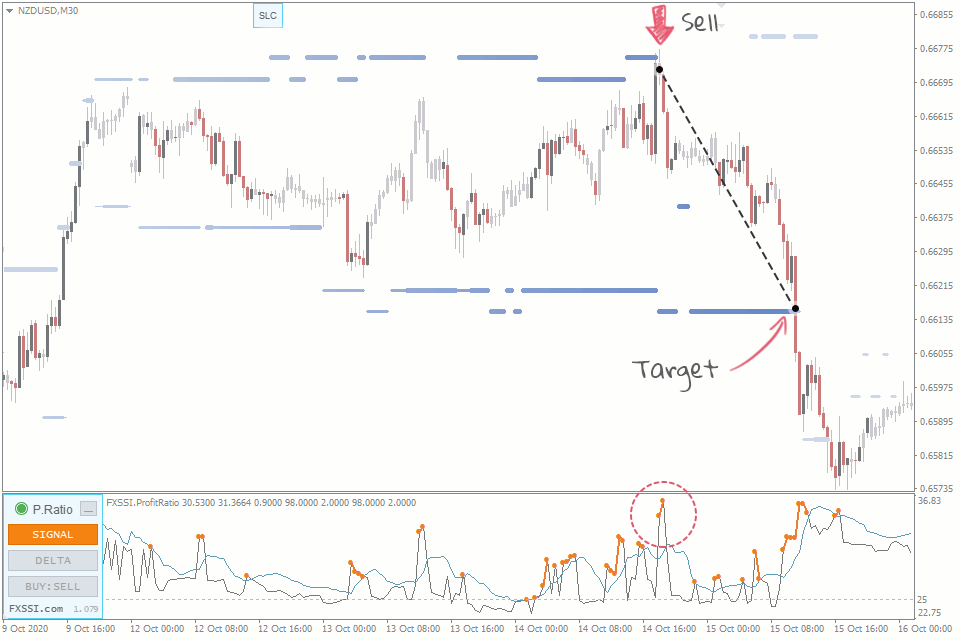
In the example above, the New Zealand Dollar breaches the previous high against the US Dollar as the Profit Ratio indicator issues a reversal signal.
Though this trade would have been successful if your stop was wide enough, by waiting for a signal confirmed by a stop hunt, you get a much better entry, shorting the actual top right before a substantial decline.
Recap
- A breakout is when price breaches support/resistance, respects and continues.
- When trading breakouts, wait for price to respect the broken level.
- A fakeout occurs when support/resistance is breached without any continuation.
- Fakeouts often lead to substantial reversals.
- Most traders lose money, FXSSI’s Profit Ratio indicator tracks net trader profitability.
- The Profit Ratio Indicator can help you identify fakeouts as they are happening.
- Big money traders need to buy when other people are selling to get filled.
- Our Stop Loss Cluster indicator highlights where this activity is likely to take place.
- Combine the Stop Loss Cluster & Profit Ratio Indicators and trade fakeouts like a pro.
Become an FXSSI Pro member today
Want to leverage this powerful fakeout trading strategy?
Tired of getting caught on the wrong side of a fakeout?
Become an FXSSI Pro member today and get access to our Profit Ratio indicator, our Stop Loss Clusters indicator and a host of other powerful tools and indicators that will help you stay on the right side of the market.