FXSSI.ProfitRatio
FXSSI.ProfitRatio Screenshots (8)


FXSSI.ProfitRatio - Overview
One of the most challenging tasks in Forex trading is an accurate determination of trend reversal points. These points are interesting because they allow you to enter the market at the very beginning of the price movement and profit from most of it.
For this very reason, various stochastic indicators are very popular as, in theory, they should predict the price reversal.
As it turned out, there are also accurate reversal indicators among the market sentiment indicator group. We’re talking about the ratio of winning traders' (Profit Ratio), namely the delta of the given parameter. The latter shows well false maneuvers, after which a reversal usually starts.
Profit Ratio Indicator
The Profit Ratio indicator displays the ratio of winning to losing trades among the currently open ones. It is used to spot potential reversal levels even before the price starts moving in the opposite direction.
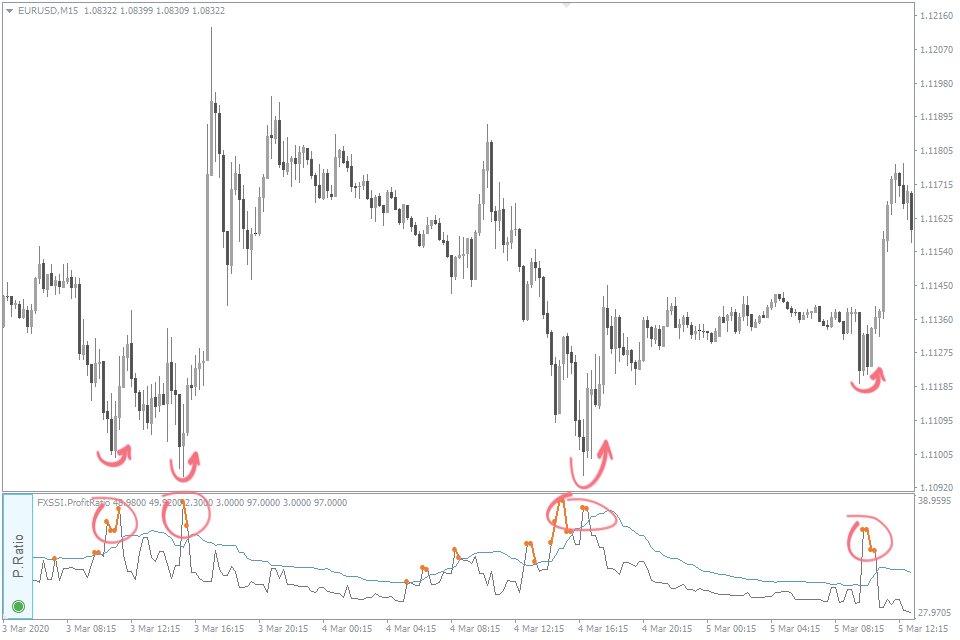
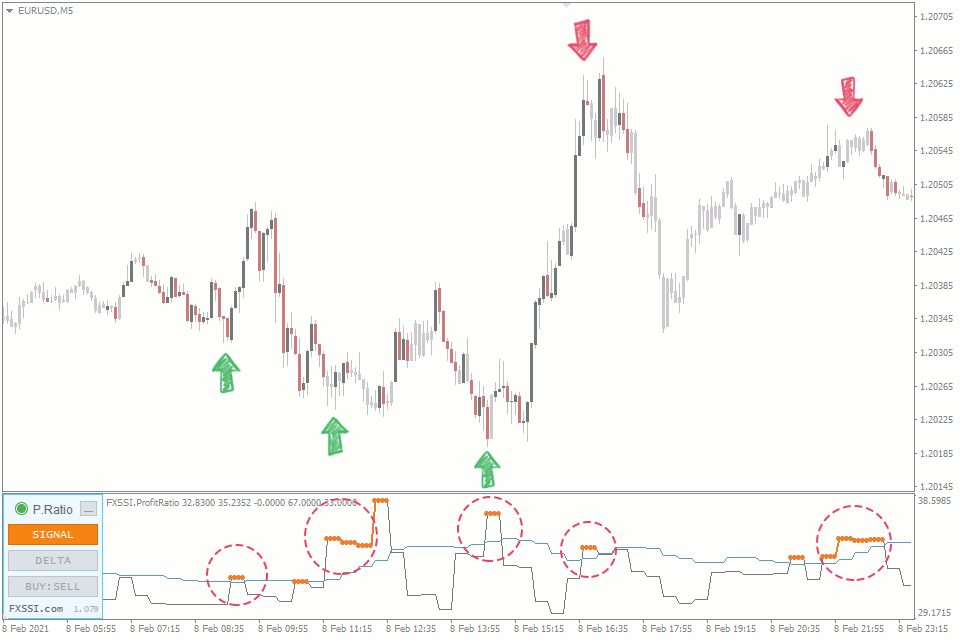
After analyzing the price chart, you can see that almost all market bottoms are accompanied by a signal from the Profit Ratio indicator:
In MT4 or MT5, the Profit Ratio indicator is presented as a chart. You can also display the delta of this parameter and the percentage of winning buyers/sellers separately.
If you often go counter-trend while day trading, the indicator will become your indispensable assistant and protect you from opening hasty positions.
What is Interesting About the Profit Ratio Indicator?
The Profit Ratio (PR) indicator represents the percentage of currently winning traders of the total number of them.
This value usually ranges from 25 to 35%.
Therefore, at any time in the market, about 70% of traders are in a loss.
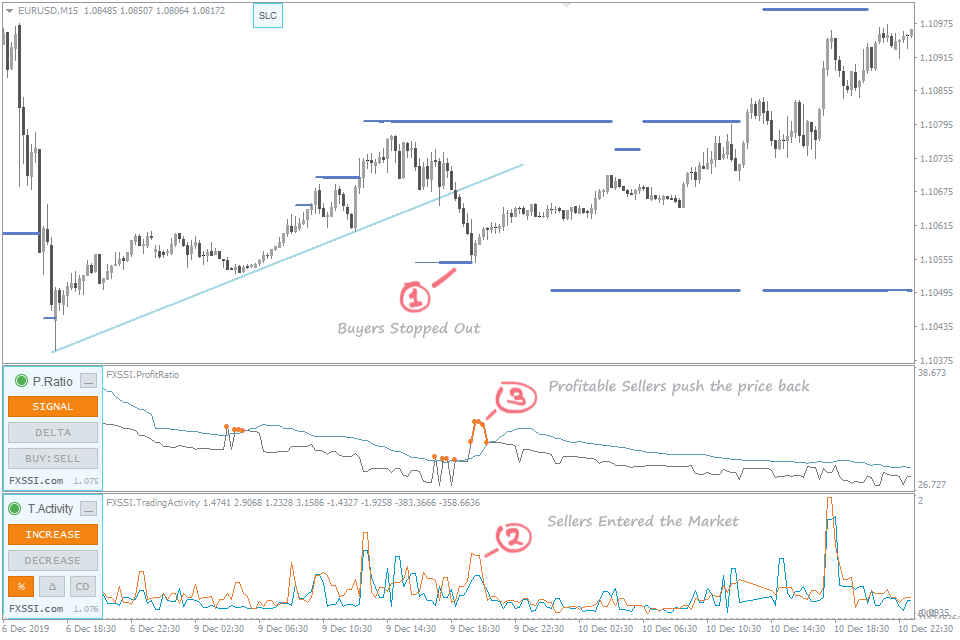
In case of a dramatic rise in the Profit Ratio over the last few candlesticks, we can say that the movement is false, and the price reversal is expected.
Interestingly, according to the classical market theory, this statement is true as well. The logic behind it is as follows: a large number of winning traders who actively close their trades push the price in the opposite direction.
As for the speculative theory of the market, the price reversal is explained by the fact that before the movement starts, a major market player makes a little maneuver in the opposite direction in order to:
- Knock traders who opened a trade in the “right” direction out of the market;
- Convince other traders that the “wrong” direction is right.
Let’s illustrate the things described above using the example of the market situation:
Both groups of traders will serve as the liquidity for opening/closing the position of a large market player in the future.
Thus, by analyzing the Profit Ratio indicator, you will at least avoid getting into the above-described groups.
Trading with the Profit Ratio Indicator
The indicator works best for identifying the price reversals. Moreover, it can be used both to open a new trade during the price reversal and close a trade due to the expected market bottom.
The indicator is used for:
- Searching for price reversal points;
- Spotting short- and medium-term trends;
- Signal hints;
- Identifying true and false movements.
How can I spot price reversals using the Profit Ratio indicator?
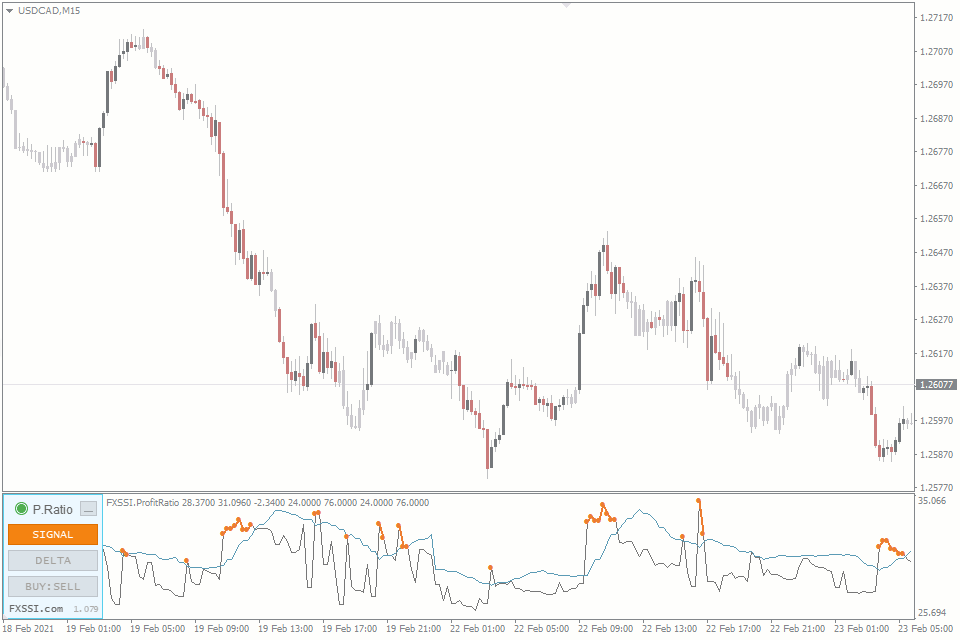
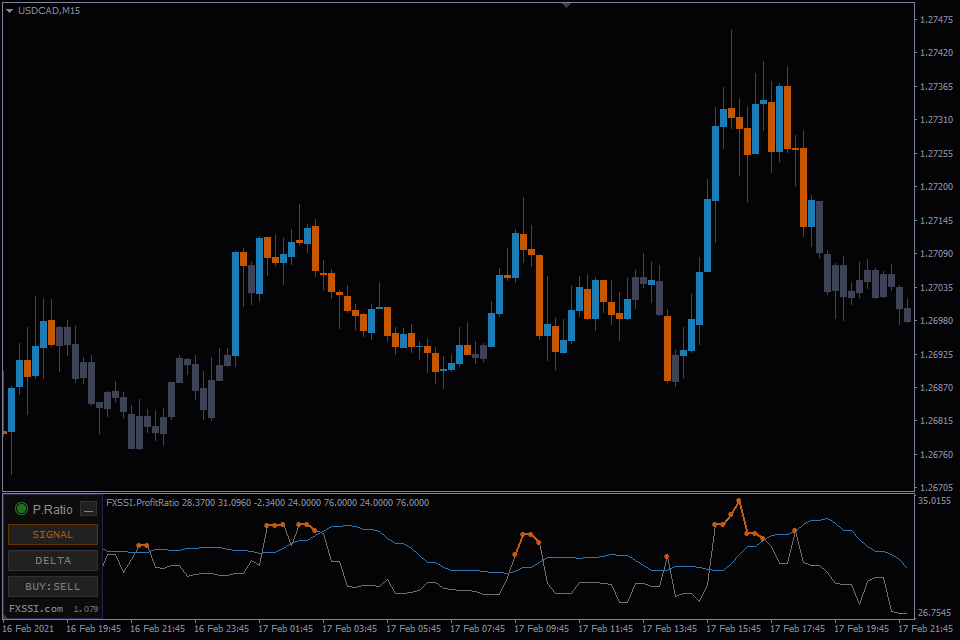
A significant rise of the Profit Ratio indicator within the current candle is a signal of a possible reversal.
To conveniently monitor the volatility of the Profit Ratio indicator readings, a signal line based on the moving average was added.
Thus, a reversal signal is generated when the Profit Ratio readings exceed the value of the signal line. These areas are highlighted in orange dots or lines in the indicator window.
The trades opened during the retracement movement have the most favorable forecast. In this case, a signal is generated at the end of the retracement. So you enter the market towards the main trend.
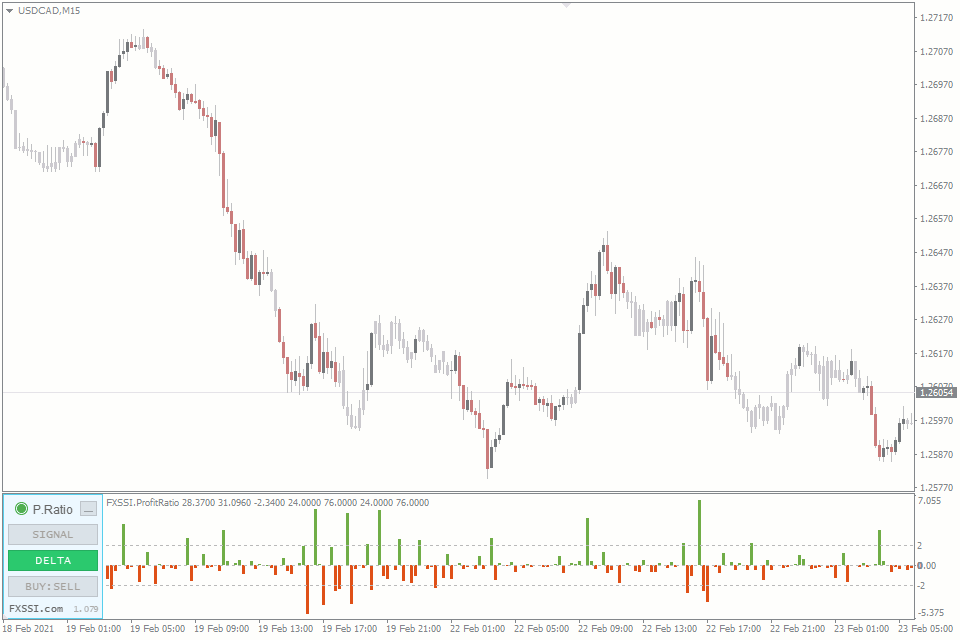
You can also use the "Delta" histogram to confirm signals. Each green bar having a value of more than 2% signals a possible price reversal.
We determine a trade direction based on the nature of the movement:
- We should buy if the candlestick preceding a signal is bearish;
- We should sell if the candlestick preceding a signal is bullish.
You should not open a trade immediately when the first signal occurs but further analyze the market situation.
In the case of a strong or key level breakout, it is better to ignore the Profit Ratio readings.
How to spot a trend with the Profit Ratio indicator
If we divide all winning traders into buyers and sellers, we’ll get an interesting tool for spotting a trend.
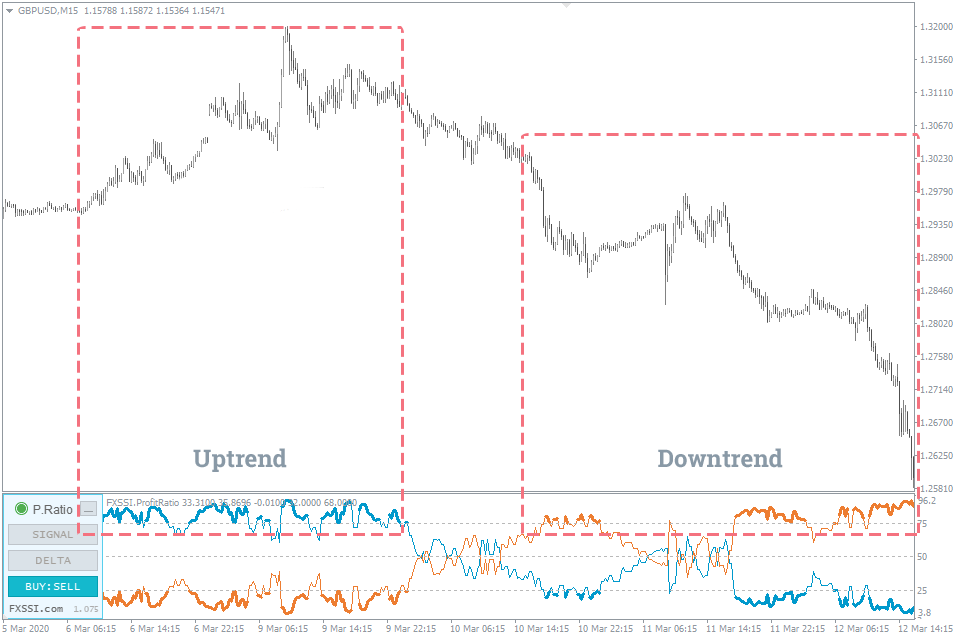
Remarkably, while an uptrend only buyers can be winning, and in a downtrend, only sellers can be winning. The thing is there is no other side of the market in both cases.
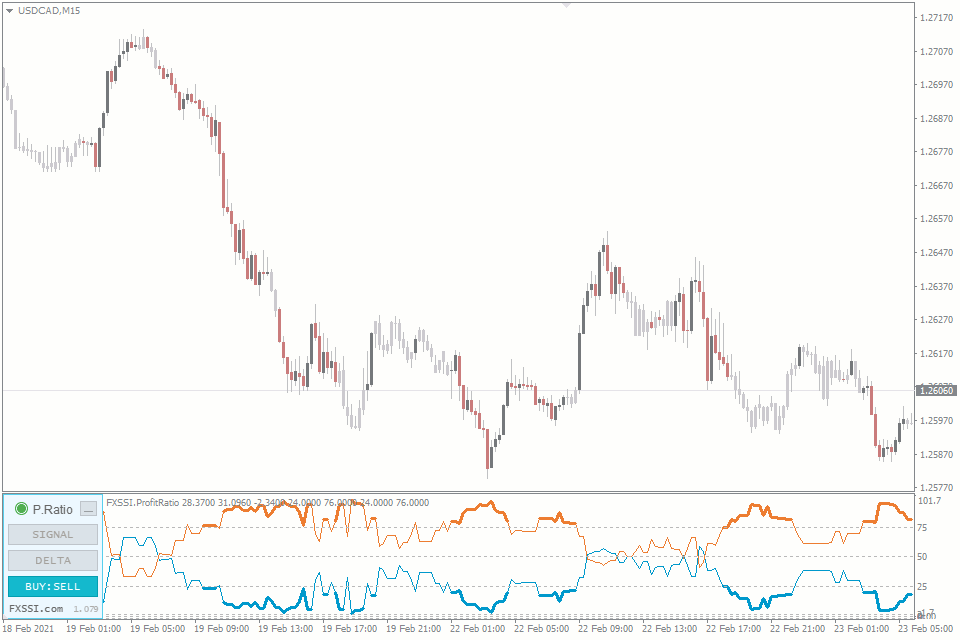
Switch to the “BUY:SELL” mode in the Profit Ratio indicator:
- If buyers are above the 75% mark (thickened blue line), this indicates that the trend is currently upward.
- If sellers are above the 75% mark (thickened orange line), this indicates that the trend is currently downward.
Also, any interactions of these indicators with the levels can be interpreted as signals. For example, the exit from the 75% zone can be considered as a signal of the end of the active trend phase, etc.
Signal hints
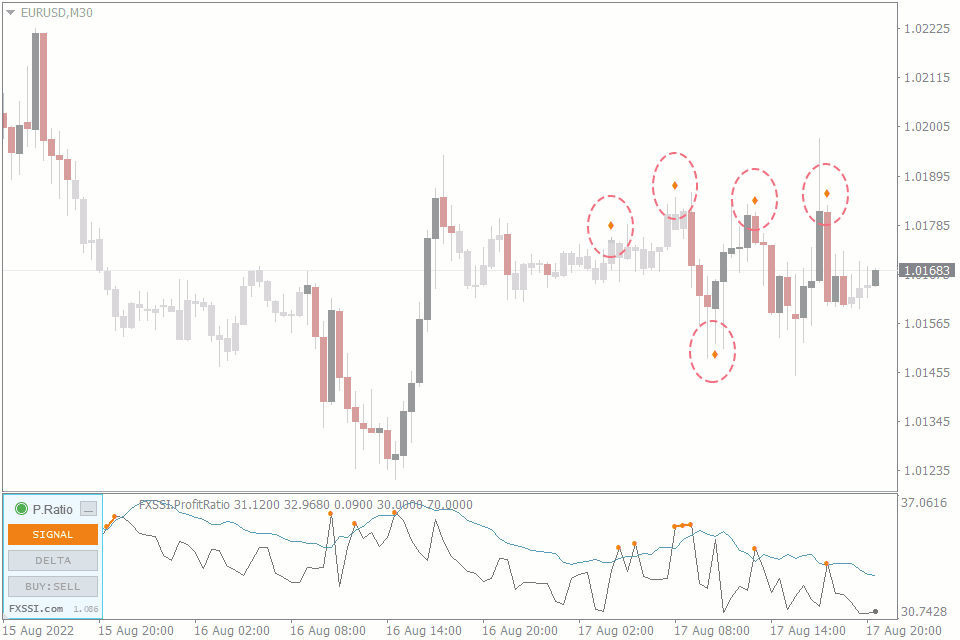
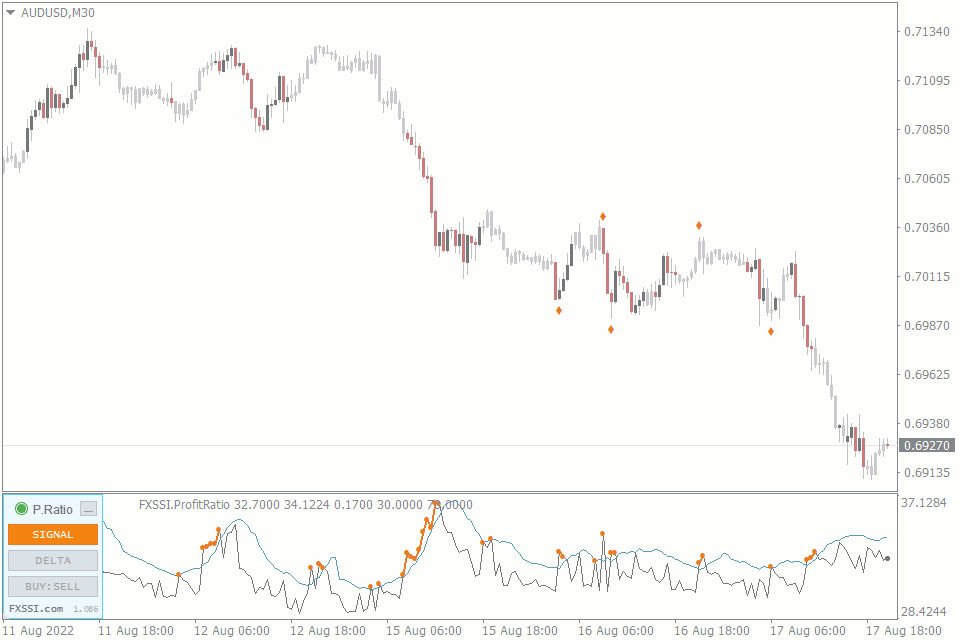
The appearance of orange diamonds means that there was a surge in the amount of profit traders in the market. Let's say there were 30% of profitable traders and on the next candle there are 32% or more.
It should be a 2% increase or more for the diamond to appear.
If the diamond is above the price, it's a reversal signal from a bullish market to a bearish one – Sell signal, and vice versa for the diamond below the price – Buy signal.
True or false movement?
Another feature of this indicator is that it can tell whether the movement is false or true:
- If you analyze a certain movement and see that the Profit Ratio indicator is gradually falling, the movement is true.
- If you analyze the market situation anywhere on the chart and see that the Profit Ratio indicator is gradually rising, this indicates that it may be difficult for the price to move towards this direction.
Moreover, within a single wave, the Profit Ratio indicator can rise in the short term at the very start of the wave, fall throughout the movement, and then rise again before reversal begins.
Anatomy of the Indicator
The Profit Ratio is a tool based on the Order Book data. It is assumed that it will work best in conjunction with the order book itself.
The Profit Ratio is calculated as follows:
We calculate the percentage of winning traders for each snapshot of the Order Book. The sequence of the obtained values forms the graph that you see in your terminal.
By performing similar calculations for each level, you can find the price at which the number of traders in profit will be minimal. We call this key level the Return Point. It provides us with that kind of information: if the price moves up 100 points, the percentage of profitable traders will decrease to 24.51%, which will be the minimum possible value.
In other words, the return point shows where the price has to move so that the Profit Ratio indicator will fall even further.
The return point (RP) is currently available in the Derivatives indicator.
Basic Indicator Features
To make your acquaintance with the indicator easier, we have selected the most significant indicator features that you should know about:
- 3 display modes:
- Signal – the PR indicator itself + signal line;
- Delta – the difference between the previous and current Profit Ratio values;
- Buy:Sell – percentage of winning sellers and buyers separately. It’s used to spot a signal direction.
Signal labels. The indicator highlights potentially the best reversal points using a thickened orange line.
For your convenience, we introduced the system of Automatic Indicators Update as well. Now you only need to restart your terminal to get their latest versions. The indicator will inform you about it in a special window.
Settings
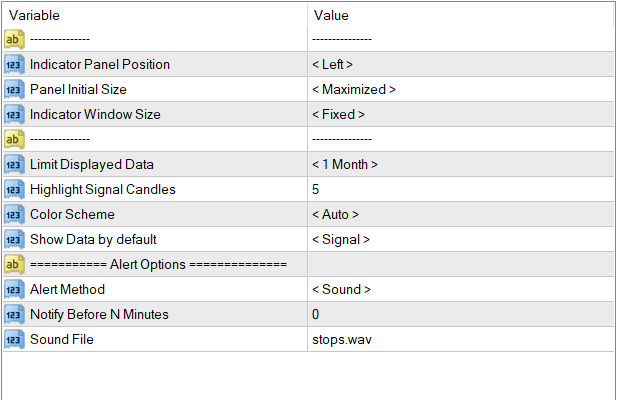
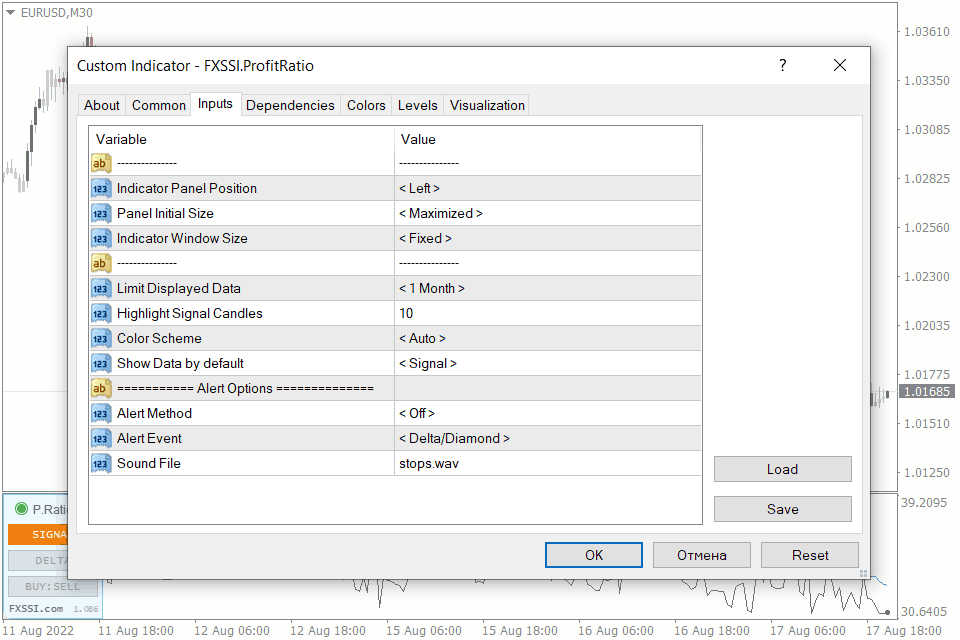
The Profit Ratio indicator, like our other indicators, can be used right out of the box simply by installing it on the chart. It is also possible to customize it. The indicator’s input parameters are described below:
Indicator Panel Settings:
- Indicator Panel Position – selects where to place the indicator panel on the chart;
- Panel Initial Size – maximizes/minimizes the panel by default when you start your terminal;
- Indicator Window Size – sets the fixed or floating height of the indicator window.
Limit Displayed Data. The given parameter defines the depth of the history that the indicator will attempt to display. Initially, the maximum depth of the downloaded history depends on the selected subscription plan. However, when using the indicator, history data are stored on your hard disk and can be used to display the history going over your plan limits. That’s what the parameter is for.
Highlight Signal Candles. Number of diamonds (signals) on the price chart.
Color Scheme. By default, the indicator automatically detects the color scheme depending on the chart background. If necessary, select the desired color scheme from the list.
Show Data by default. It determines which of three data types will be enabled by default when you start your terminal or switch the time frame.
How to add FXSSI.ProfitRatio in MT4/MT5
The FXSSI.ProfitRatio indicator is part of the "FXSSI Pro" package, which also includes several other professional indicators.
Follow the instructions below to install the "FXSSI Pro" indicators package to your MT4 terminal:
- Download the ZIP-archive with "FXSSI Pro" indicators by clicking the link at the top of the page;
- Extract the contents of the archive (indicator files and DLL library) to the MQL4/5 folder of your terminal;
- If the system offers you the File Replacement, click – Yes;
- Restart the MT4/MT5 terminal;
- Run the indicator by double-clicking its name in the MT4 Navigator;
- Check the "Allow DLL imports" box and click "OK";
- Go through the Authorization Procedure: click the "Authorize Link" that will appear after you first start the indicator, and sign in to your account;
- The indicator will be displayed on the chart;
- Adjust the indicator settings according to your needs: press CTRL+I, select the indicator from the list and switch to the "Inputs" tab.
If you have any difficulties while installing the indicator, please view the detailed instruction.


