How to Identify Trend Reversal in Forex
If you open a trade at an early stage of a trend, you can make a higher profit. You may also benefit from the entire trend if you exit the trade at its end. This should be a feasible task as long as you can find trend reversals in the market.


Trend reversal is a change in the general direction of the price movement from upward to downward or vice versa. Anticipating a trend reversal in advance gives you a chance to set up the take profit of a current trade in time or open a position at the best price in the opposite direction.
Trend movements, in general, allow you to make a good profit in the Forex market. And knowing how to identify a trend can be a valuable skill for every market participant.
But let's get back to the matter at hand – how does one identify a trend reversal in Forex?
Determining Trend Reversals on the Indicator-Free Chart
Probably, the easiest way to identify a trend reversal is to analyse the movement of a currency pair “by eye”.
You can use price patterns to spot a trend reversal on an indicator-free chart. For example, technical analysis patterns are popular among traders, since finding them on the graph gets a lot easier over time.
The most common reversal patterns are:
- Head and shoulders;
- Double top;
- Triple top;
- Wedge;
- and Dragon.
The inverted analogs of the given patterns are also reversal signals.
But reversal patterns have disadvantages as well. In particular, you can tell that a trend is going to reverse only when a currency pair has formed a pattern.
Even if you notice an emerging pattern, the theory of technical analysis advises you to take your time opening a trade until the pattern is complete. As a rule, the price will cover the distance equal to a considerable number of points by this time, and the potential profit may be lost.
However, there are ways to predict the reversal of a local trend. They include Price Action strategies, which allow you to determine the future direction of the price based solely on its current movement.
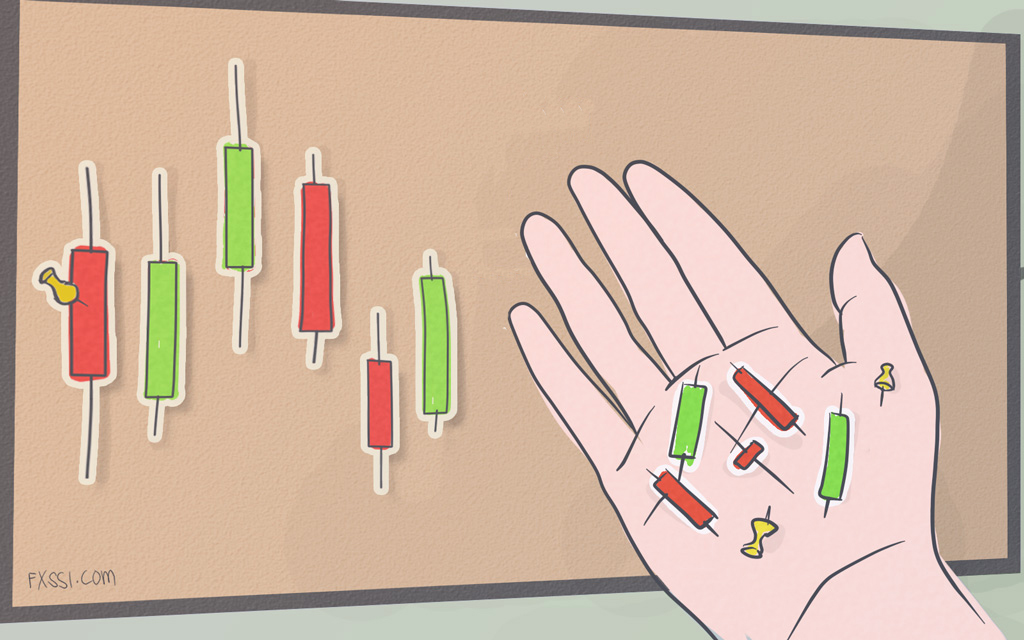
The analysis of candlestick patterns underlies the Price Action strategies. It is an efficient tool that can help you determine the direction and the strength of a trend, as well as potential reversal points.
The most well-known reversal patterns of the Price Action strategy include:
- Doji;
- Hammer and Hanging Man;
- Bullish and Bearish engulfing;
- Morning and Evening Star;
- Dark-cloud cover and Piercing pattern;
- Harami and Harami Cross.
An Example of determining a Trend Reversal Using Technical Analysis Patterns
After a prolonged rally in EUR/USD, the currency pair has formed the “Head and shoulders” pattern.
Having tested the pattern’s neckline, the price headed downwards.
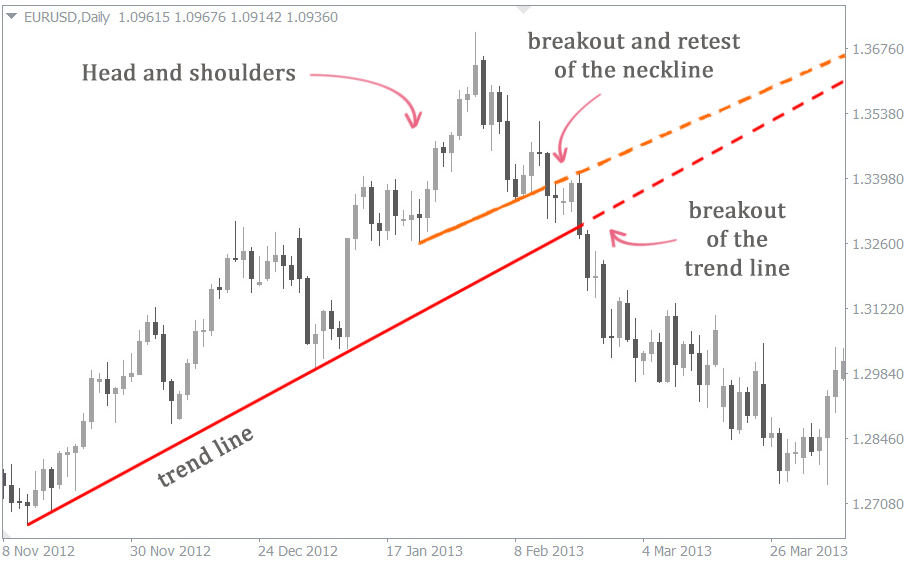
In this case, it’s obvious that we are dealing with a reversal. The pullback wouldn’t be deep compared to the previous upward movement.
Additionally, you can notice candlestick patterns on the chart. The double left “Shoulder” has been formed by the “bearish engulfing” and the “Harami”. The high of the “Head” is another “bearish engulfing”. The “Doji” pattern can be noticed in the right “Shoulder”. Finally, having tested the neckline, the price forms the “bearish engulfing” pattern for the third time.
You can see that the black candlesticks on the right side of the “Head and Shoulders” pattern are longer on the left. White candlesticks, on the contrary, are shorter. It suggests that bears are getting more determined than bulls.
The combination of the described signals is a sufficient reason to predict a possible trend reversal.
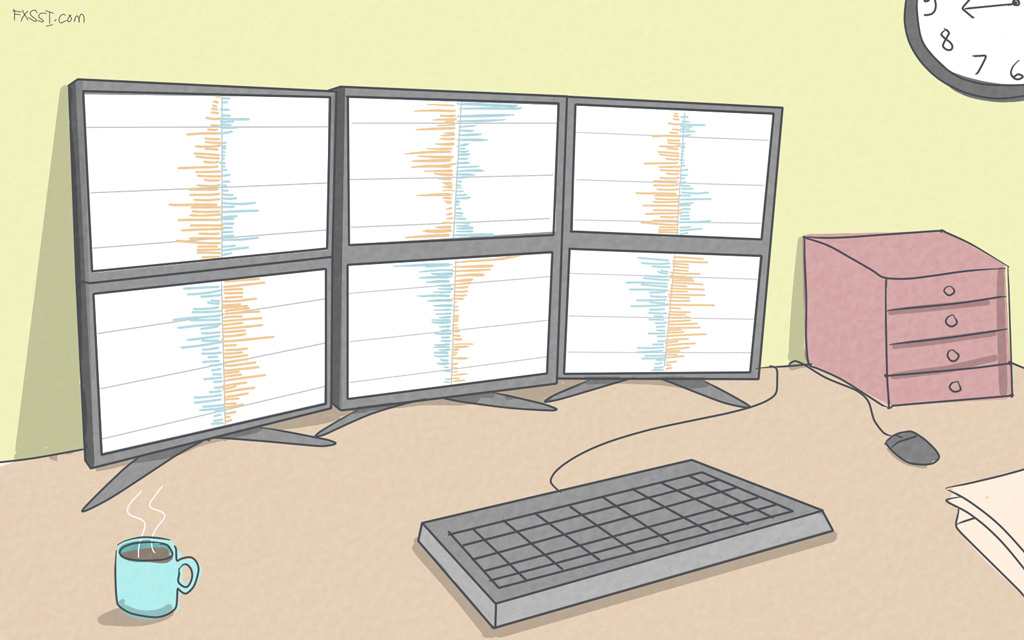
Identifying Trend Reversals With Indicators
Technical analysis offers a lot of indicators that can help in spotting trend reversals. As a rule, they represent various combinations of moving averages or oscillator-type indicators.
Using indicators in trading has its advantages, including the following:
- Objectivity. The analysis of an indicator-free chart involves searching for technical analysis patterns, the judgment on which is strictly individual. Indicators' signals don’t depend on the opinion of a particular trader and thereby are devoid of subjectivity.
- Relative simplicity. The thing is that high-quality analysis of an indicator-free chart requires experience and expert knowledge. It’s usually hard for novice traders to show off such skills. Indicators allow you to receive signals, even if a trader is unable to conduct a comprehensive analysis. Besides, even experienced market participants prefer to rely on indicators’ readings.
- Variety of strategies. The combination of various indicators allows you to develop different strategies, many of which prove to be quite efficient in trading.
When trying to spot a reversal, one might find classic indicators available in the MT4 trading terminal quite useful. They include, for example:
- Momentum.
- Stochastic.
- Parabolic.
- MACD.
In addition to the basic signals of the oscillators, you should pay attention to additional factors confirming a reversal, such as divergence and volume:
Divergence is the difference between the price and the oscillator charts. Simply put, this is a situation in which each subsequent low on the downtrend graph is lower than the previous one, while each low on the oscillator chart is higher than the previous one. The opposite is true for an uptrend.
Volume is the number of trades made in the Forex market over a particular period. A true reversal momentum is always confirmed by increased trading volumes.
In addition to the classic indicators, reversal signals are also generated by the Trix.Crossover indicator. It’s based on the Trix, which is a triple exponential moving average.
The Trix.Crossover is displayed in a sub-window below the currency pair chart. It’s perfect for intraday trading, allowing you to quickly make a trading decision even during a sudden trend reversal.
An example of Using the Trix.Crossover Indicator to Identify a Trend Reversal
The EURUSD currency pair forms a straight downward channel that allows you to profit both from Sell and Buy trades.
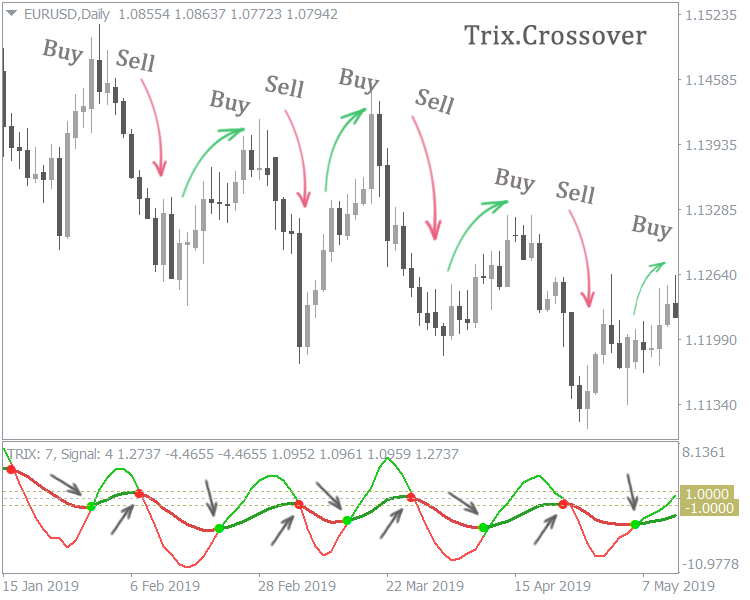
In this case, the Trix.Crossover allows you to determine quite precisely when it’s reasonable to open long or short positions. The indicator provides signals using two curves in the sub-window: fast (signal) and slow (major) ones. The crossing of both of these lines acts as a reversal signal.
- If the signal line crosses the major one from above, consider it to be a short position.
- If the signal line crosses the major one from below, consider it to be a long position.
As you can see from the chart, each of the reversal signals was subsequently confirmed.
Using the Trend Lines Indicator
An easy and reliable way to spot a trend reversal is to use trend lines. Basically, it’s about support and resistance lines.
In this case, a true breakout of the trend line is a reversal signal.
To avoid wasting time on drawing support and resistance on your own, use the automatic trend lines indicator. It spots the most significant lines and automatically plots them on the chart.
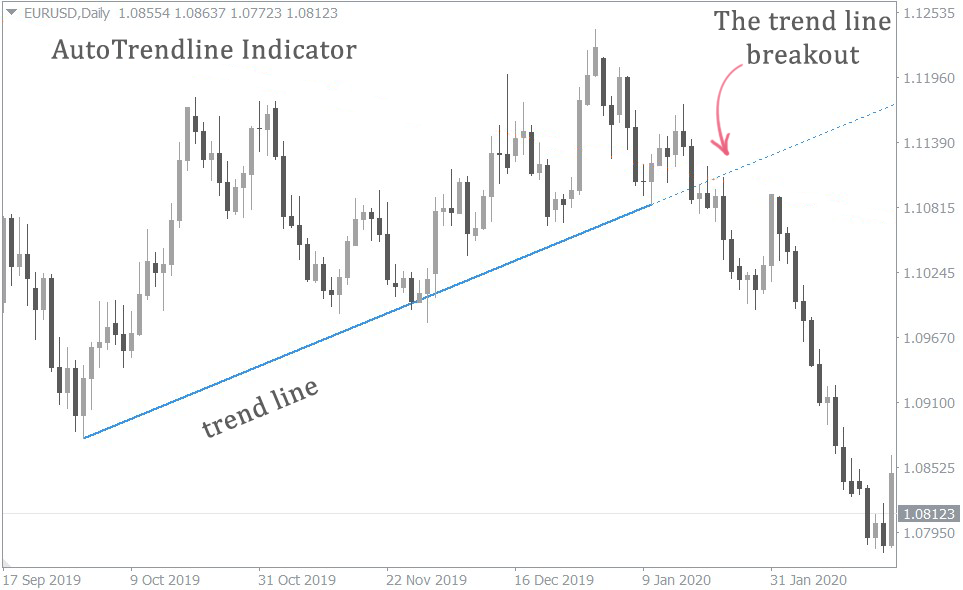
The given example illustrates how the EUR/USD currency pair breaks the trend line. The price is steadily heading downwards, after having tested the broken support.
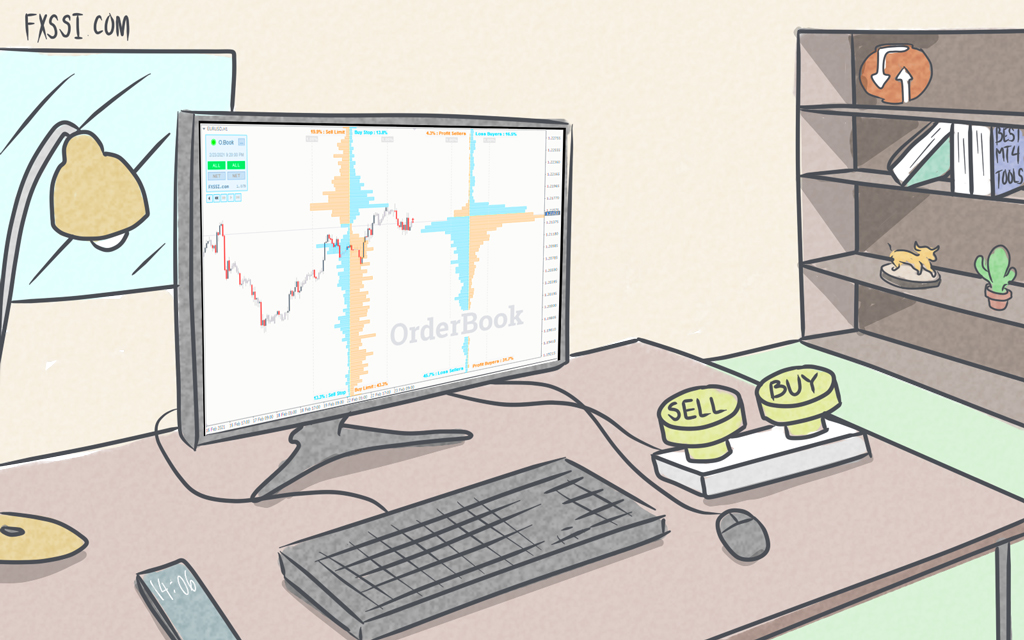
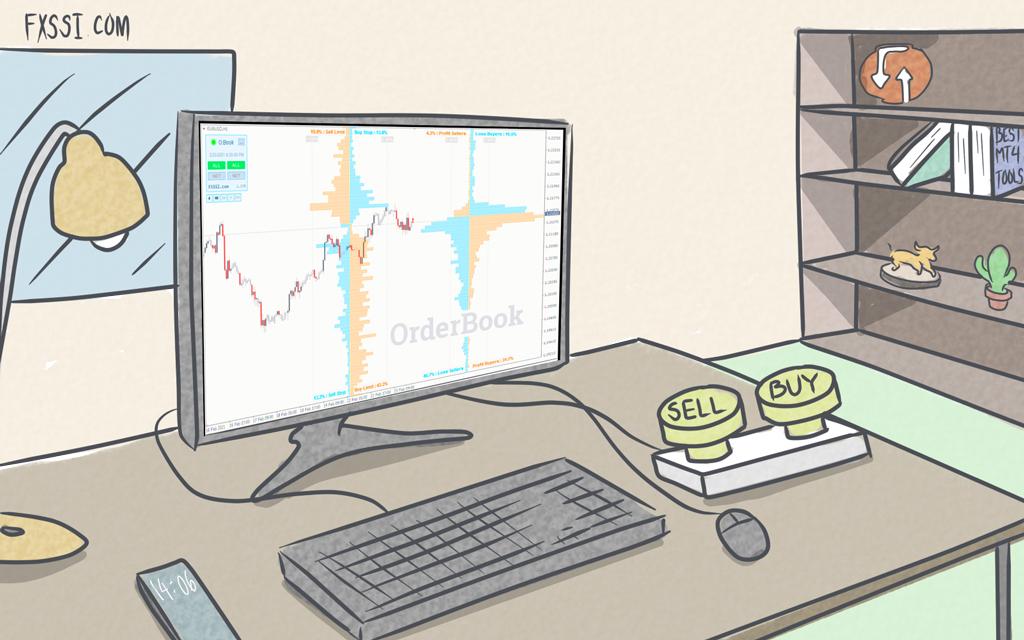
Using the Reversal Points Indicator – Profit Ratio
Profit Ratio refers to the market sentiment indicators. Many of them determine the current ratio of bulls and bears, allowing a trader to choose between opening a long and a short position.
There are also reversal indicators among the market sentiment indicators. The Profit Ratio is one of them.
It calculates the profit ratio, i.e., the percentage of traders whose trades are currently winning. This parameter accurately reflects the false price impulses, which tend to precede reversals. In many cases, this will allow you to identify potential reversal points even before the price movement changes to the opposite.
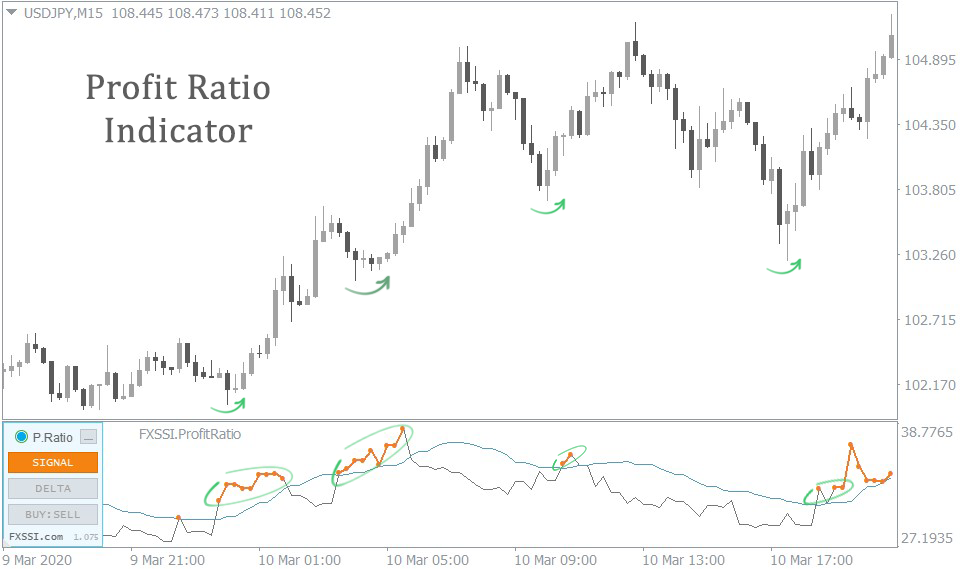
As the example shows, the Profit Ratio indicator accurately identifies the points on the chart, which then become extremes. For this reason, it is a perfect tool for traders who like countertrend trades.
Don’t Forget About the Risks!
Trading against a trend is a pretty risky practice, as it often results in substantial losses.
However, countertrend trades can yield good profits. They allow you to enter a trade at the very beginning of a trend and use the entire directional price movement.
That is why many traders prefer to take a calculated risk.