FXSSI.CurrentRatio
FXSSI.CurrentRatio Screenshots (8)


FXSSI.CurrentRatio - Overview
When talking about trading “against the crowd” or trading on sentiment, what we mean is the analysis with the buyer/seller ratio, also know as SSI (Speculative Sentiment Index).
It is the most easy-to-use and intuitive indicator for a novice trader and probably the most popular one for the same reason.
Current Ratio Indicator
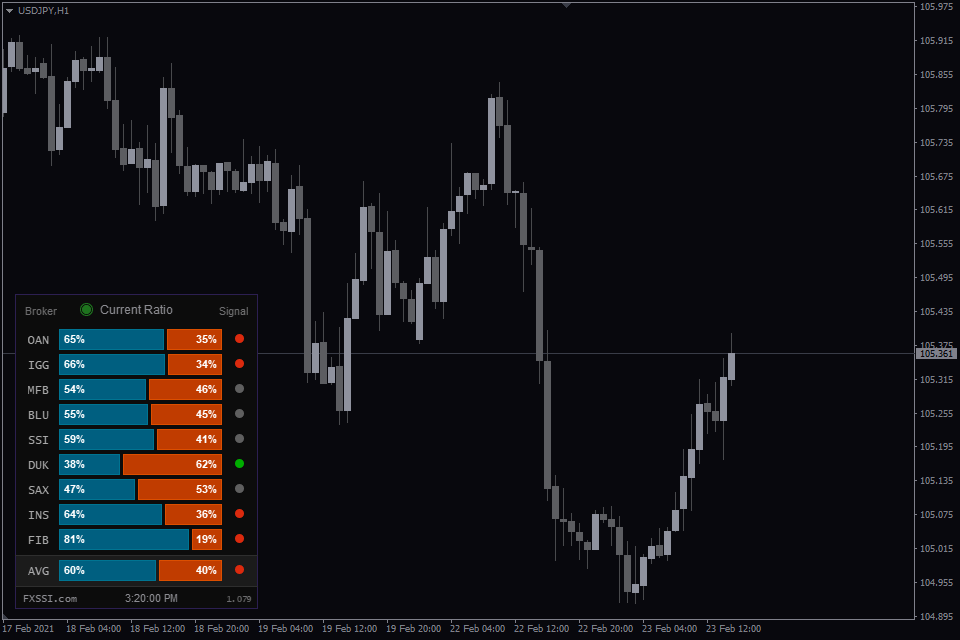
The Current Ratio indicator shows the ratio between buyers and sellers currently being in the market. The ratio data comes from several major brokerage companies and some services, such as ForexFactory.
To display the open position rate as a chart, you need a separate FXSSI.Ratios indicator.
The indicator takes into account only currently open trades, while the closed ones don’t affect it.
The given indicator provides data on the long vs short ratio (i.e., client positioning) from 10 sources for 12 Forex pairs (these figures may change over time). Today, there are numerous sources of the ratio of positions, but we use only the most relevant of them in our indicators and tools.
The indicator is used for:
- Medium-term trading;
- Determining a trade direction;
- A quick assessment of a trend state.
The Current Ratio indicator is not resource-intensive and is rather compact, making it almost a must-have tool in the arsenal of every trader regardless of the strategy being applied.
Why Is It Important to Analyze the Long/Short Ratio?
According to a popular belief, about 95-99% of traders lose their money in the market, i.e., they trade at a loss. Therefore, trading in the opposite direction from most traders can be profitable.
This indicator was developed specifically for such a quick assessment of the current sentiment of most traders.

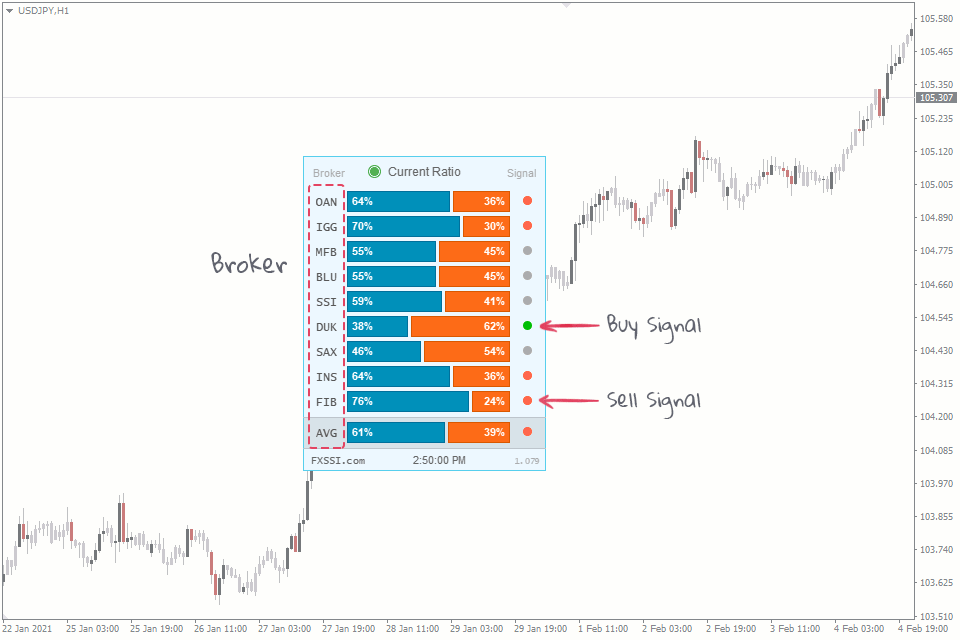
The image above shows the easiest analysis method using this indicator. The blue bar represents the percentage of buyers, while the orange one reflects the percentage of sellers.
If most traders go long, you should look for a short position. If most of them expect an asset to drop in price, you should consider a long position.
Trading With the Indicator
The basic idea of how the indicator works is not to open a trade in the same direction as most traders in the market do.
By following this simple principle, you'll increase your chances of making a successful trade.
Besides, when you trade against the market majority, you trade with a trend, since most of the trades are always open against the trend.
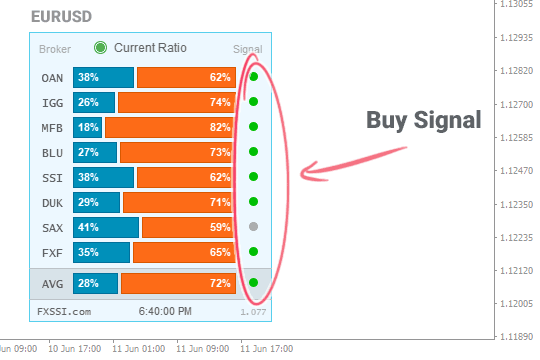
Buy Signal
You may go long when:
- Most sources signal Buy (green circle);
- The signals are distributed equally;
- All the sources don’t give any signals (gray circle).
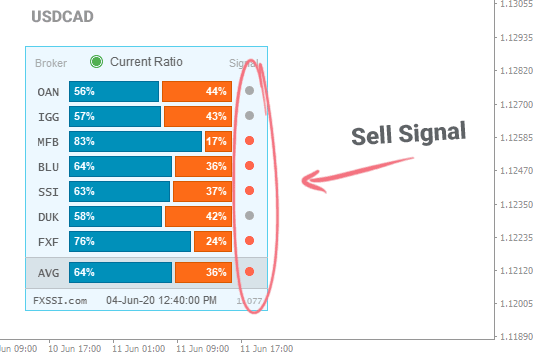
Sell Signal
You may go short when:
- Most sources signal Sell (red circle);
- The signals are distributed equally;
- All the sources don’t give any signals (gray circle).
As you can see, the main idea is not to open a trade in the same direction as most retail traders do; however, if there is no such a majority, you can open a trade in any direction.
To increase the win-rate of signals, you can develop your own strategies using this indicator. For example: “Open a trade only when three or more sources give you a Buy signal, while none of them shows a reverse signal.”
Indicator Features
Some of the indicator features:
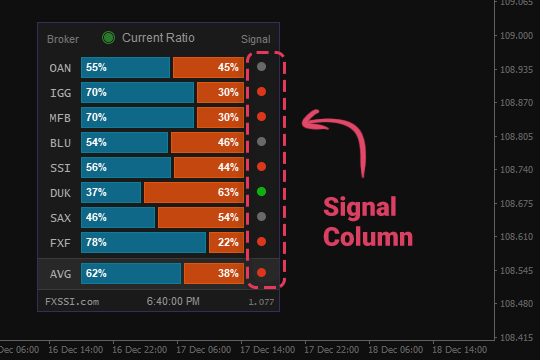
Signal “lights”. The given feature allows you to interpret the indicator readings quicker. This is because we perceive and convert colors into information much faster than numbers.
You can specify the conditions for the signal to appear in the indicator settings on your own. For example, if the value is 40% or less, the signal will be green; if the value is 60% or more, it will be red. Gray color represents a neutral signal that occurs when the indicator value ranges from 40% to 60%.
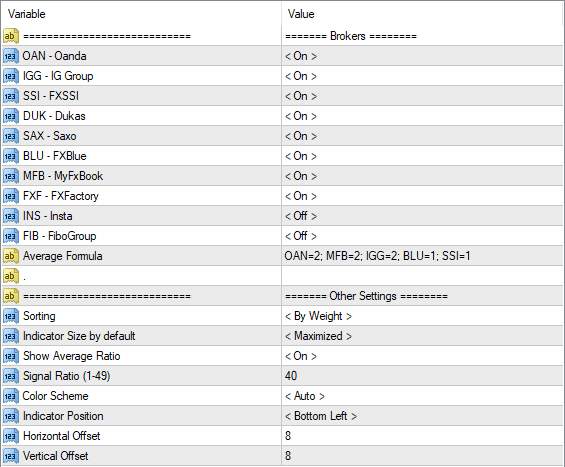
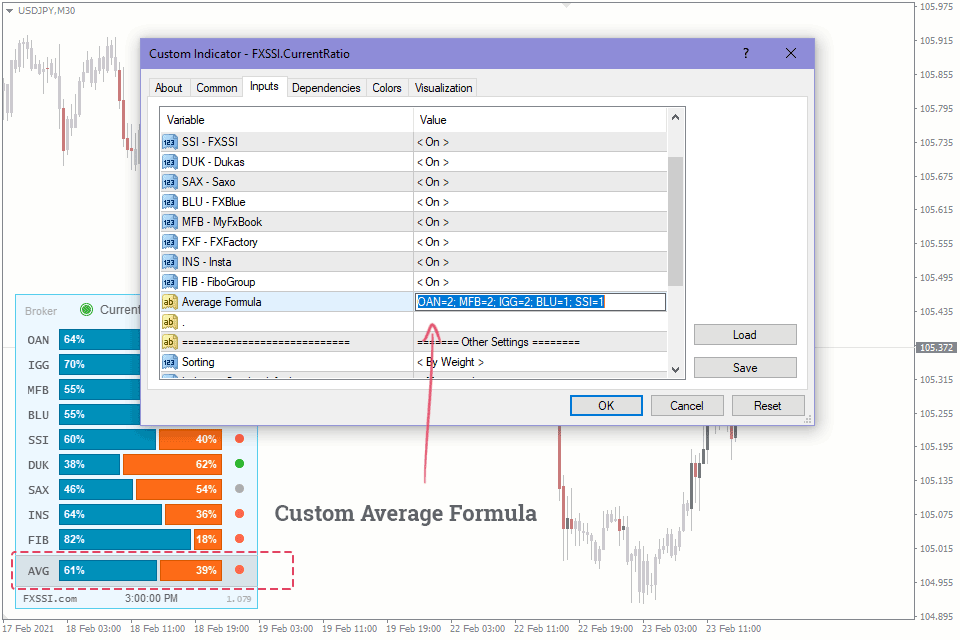
The custom formula for AVG (average value) – enter your own formula for calculating the average buy/sell ratio value. Input format: OAN = 2; MFB = 2; IGG = 2; BLU = 1; SSI = 1, where
- "MFB" – three-character code of the source;
- "2" – the share of the source in the average value.
You can add or remove sources from the formula, as well as specify any weight coefficient.
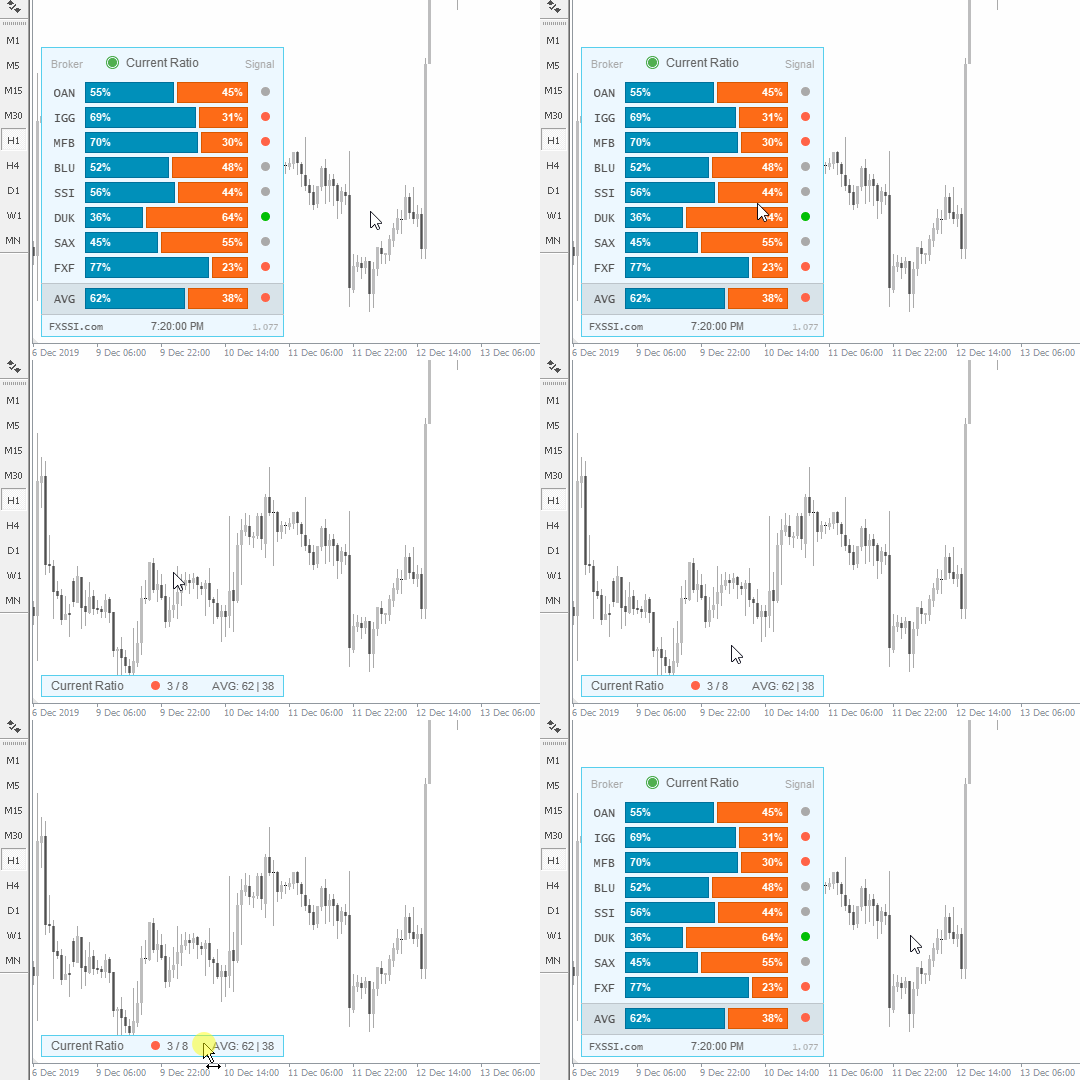
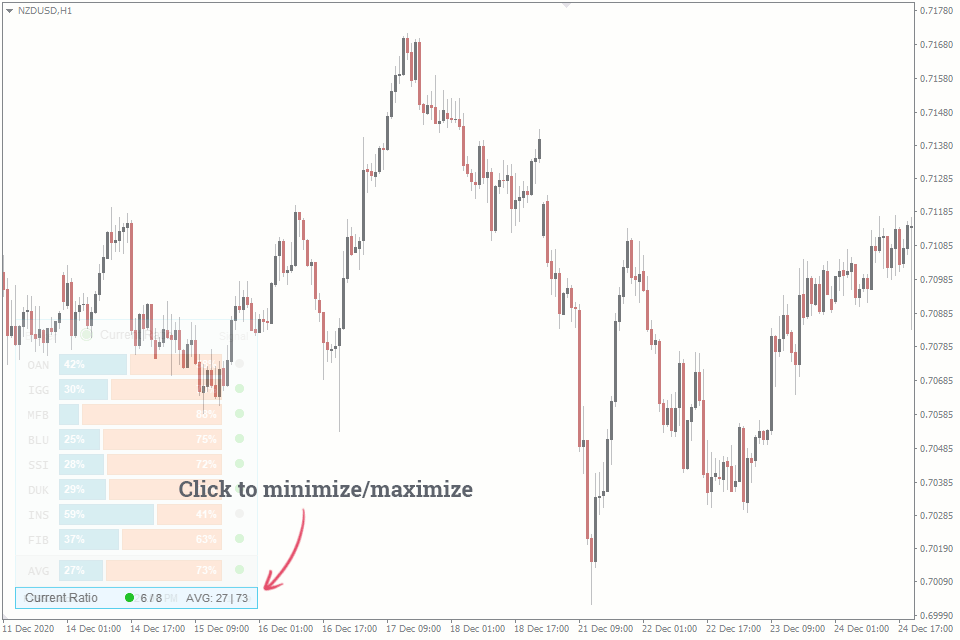
Minimizing. You can minimize the indicator panel by clicking on it or set minimizing as default.
When minimized, the indicator is still informative, since it indicates the direction of the maximum number of signals.
Let’s consider the example above. When maximized, we can see 3 Sell signals and 1 Buy signal. When minimized, we see the number “3” and the red “light”.
If we have 1 Sell signal and 1 Buy signal, the one which value is furthest from 50%, will be displayed.
Auto settings. The indicator is equipped with a feature of automatic detection of color scheme and time zone.
For your convenience, we have implemented the Automatic Indicator Update system. Now you just need to restart your terminal to get the latest version. The indicator will inform you about it in a separate window.
Indicator Settings
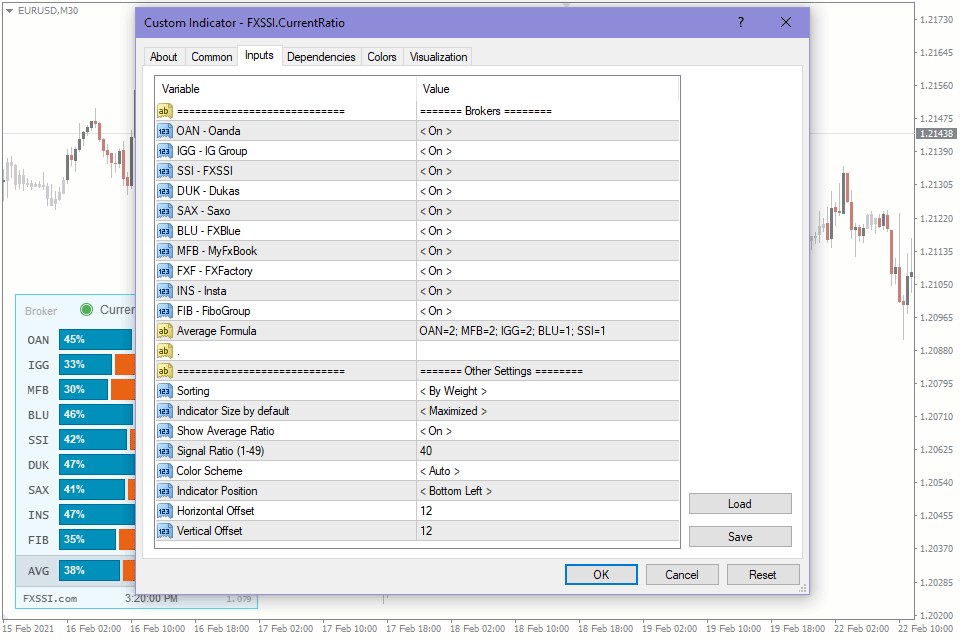
Brokers. Select those available brokers that should be displayed on the indicator panel (“On”) and those that you want to disable (“Off”).
Average Formula. Specify the brokers and their weight in the suggested format to include them in calculating the average value.
Sorting. Defines the order in which brokers are placed on the chart. There are three options to choose from:
- Alphabetically;
- By broker’s weight;
- In the descending order of values.
Indicator Size by default. Determines the state of the indicator panel (minimized/maximized) when you start your terminal or switch a timeframe.
Show Average Ratio. You can use this parameter to disable displaying the average value on the indicator panel.
Signal Ratio. Specify the SSI value, above which the indicator will signal the Buy or Sell. You can specify the values from 1 to 49. If 40 is set, the Buy signal will be generated when the long/short ratio is 40 or less, and the Sell signal will be generated when it is 60 or higher.
Color Scheme. By default, the indicator automatically detects the color scheme depending on the chart background. If necessary, select the desired color scheme from the list.
Indicator Position – selects the chart corner to place the indicator panel.
Vertical, Horizontal Offset – sets the offset (in pixels) from the selected chart corner.
How to add FXSSI.CurrentRatio in MT4/MT5
The FXSSI.CurrentRatio indicator is part of the "FXSSI Pro" package, which also includes several other professional indicators.
Follow the instructions below to install the "FXSSI Pro" indicators package to your MT4 terminal:
- Download the ZIP-archive with "FXSSI Pro" indicators by clicking the link at the top of the page;
- Extract the contents of the archive (indicator files and DLL library) to the MQL4/5 folder of your terminal;
- If the system offers you the File Replacement, click – Yes;
- Restart the MT4/MT5 terminal;
- Run the indicator by double-clicking its name in the MT4 Navigator;
- Check the "Allow DLL imports" box and click "OK";
- Go through the Authorization Procedure: click the "Authorize Link" that will appear after you first start the indicator, and sign in to your account;
- The indicator will be displayed on the chart;
- Adjust the indicator settings according to your needs: press CTRL+I, select the indicator from the list and switch to the "Inputs" tab.
If you have any difficulties while installing the indicator, please view the detailed instruction.


