3 Strategies for Analyzing the Ratio of Open Positions
We want to share some of our best practices and strategies based on the analysis of traders' open positions. You can use them as a basis for making trading decisions or as an additional signal for an already proven strategy.


If you are not familiar with the concept of the ratio of traders' positions, then it is advisable for you to read our article on open positions.
We use our proprietary developments as the tools for analyzing open positions as well as partially analyze the data obtained from the OrderBook indicator.
A total of three strategies based on the long-term, medium-term and short-term analysis of the ratio of traders' positions will be presented.
Long-term analysis strategy
The strategy is based on the theory which states that the market always moves against the majority (usually against us). This is not some conspiracy theory, but the realities of the market are such that small money (which is more in total) must lose to big (smart) money.
According to the long-term strategy, market entry signal is generated when the ratio of traders positions for most brokers on one side is superior that the one on the other side (for example, there are much more buyers than sellers). At that, it is necessary to trade in the opposite direction from the opinion of the majority. Such a signal can last from several months to a year.
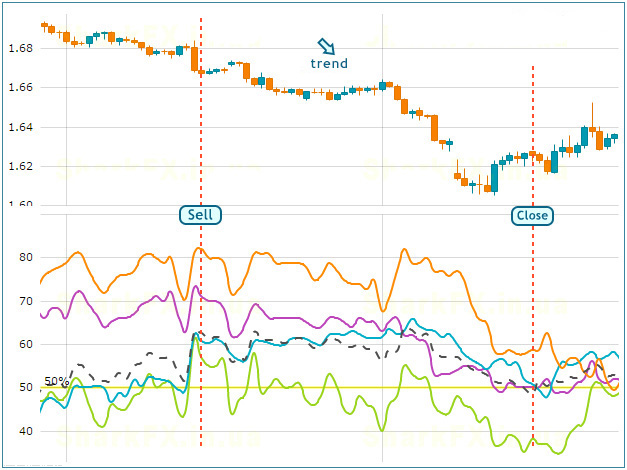
Let's take a closer look at the example of the position ratio for EUR/USD (see a description below the picture):

What can we see in the picture? We can see that the overall superiority in the ratio on one of two sides is a great indicator of the trend. As we wrote in one of our articles, "When opening a position against the crowd, you open the position towards the trend."
Advantages of the strategy:
- Like all long-term strategies, it is easy to use.
- It won't be long before you get a signal.
- You need to trade mainly towards the trend.
Disadvantages of the strategy:
- It isn’t good for all financial instruments. Buy trades always prevails for metals and also AUD/JPY (carry trade). In addition, this strategy generates weak signals for low liquid currency pairs.
- It doesn’t indicate specific entry/exit points, but only signals the “right” direction for a future trade.
- The strategy is crude, so we recommend you to use it in conjunction with more reliable strategies.
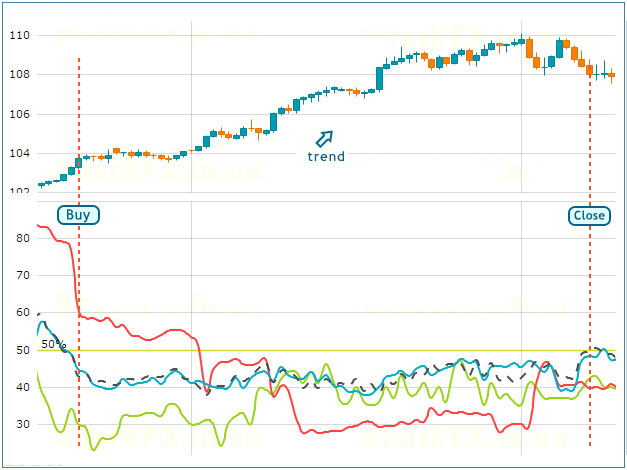
Now, we add some examples for other currency pairs:
- GPU/USD;
- USD/JPY.
Medium-term Analysis Strategy
The strategy is about to find sharp fluctuations in the ratio of open positions. We are interested in a significant change of this indicator in one direction for most brokers. As in the previous strategy, we will seek for the entry in the opposite direction from a “surge”.
Here is an example of such a “surge” on the NZD/USD chart:
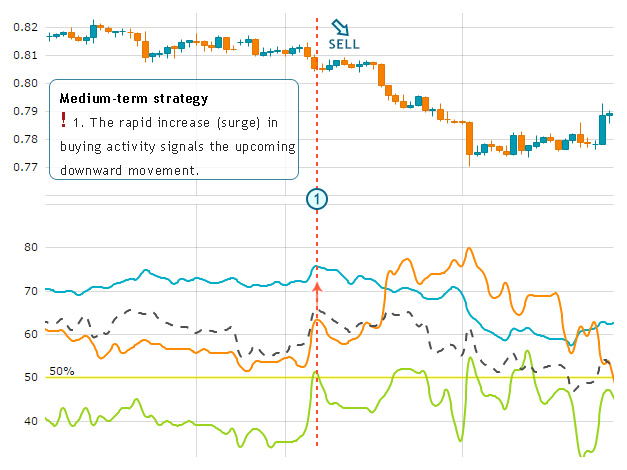
This kind of surge is nothing but the “smart” money entering the market. Creating favorable conditions, they force the crowd to buy and yet they accumulate the opposite positions. Probably, it is not a secret for you that trades of big players are not displayed on the chart of the ratio of open positions, hence the “surge” on the chart.
In most cases, a sharp increase in the number of buyers/sellers will coincide with important news. In this case, you should wait until the volatility subsides, and then seek for the market entry point. Also we note that there are no specific objectives related to this strategy, but such a “surge” can tell us about the trend direction for the next few weeks.
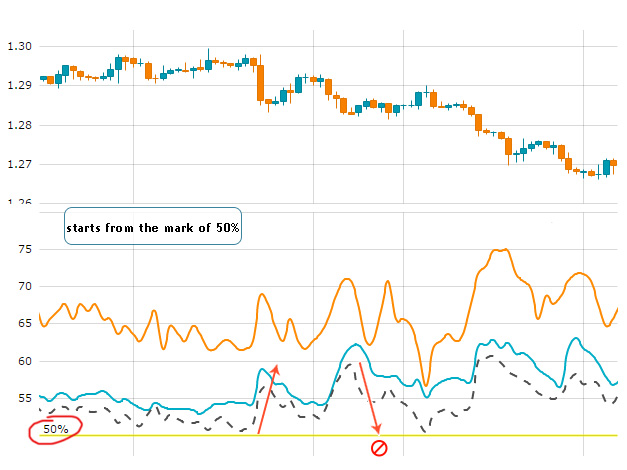
There is another important nuance: the signal quality is much better when the “surge” starts from the mark of 50%, but not towards it. Here is an example:
Advantages of the strategy:
- It generates good-quality signals.
- It implies trading with the trend.
- It includes a long-term strategy signal.
Disadvantages of the strategy:
- It will be long before you get a signal.
- There is no specific market exit point.
Short-term Analysis Strategy
We will use DOM Snapshots tool where you should enable the “Net” option for the short-term analysis of open positions.
We are interested in the dense clusters of buyers/sellers located within ~100 points from the current price. To put it in trading terms, these clusters serve as resistance levels. In fact, traders are simply not allowed to close trades at breakeven point.
The sought-for cluster looks something like this:
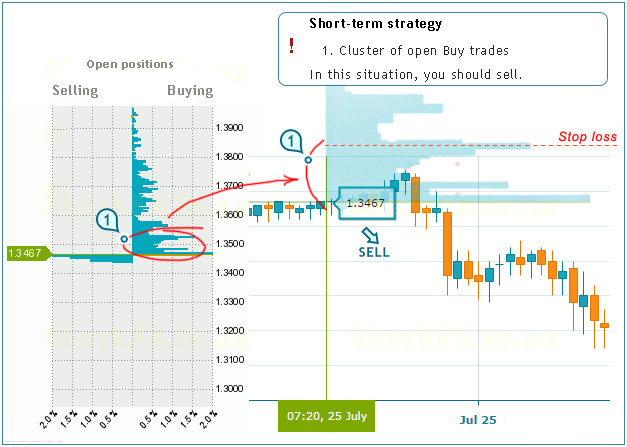
You can enter the market when the price comes very close to a cluster, and a trade should be opened when the price bounces off this cluster.
Stop loss need to be set inside the area of cluster of trades as shown in the picture. To learn more on this subject, we advise you to read the article “How to Set Stop-Loss Properly?”.
A signal is stronger if you open a trade towards the trend in this way:
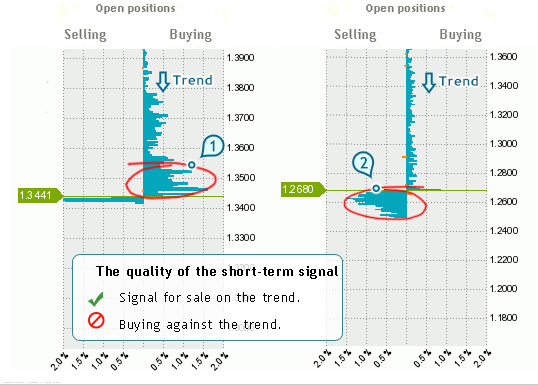
The signal itself is valid until the next impulse occurs – this time equals to about two days.
Advantages of the strategy:
- It provides a specific entry point and stop loss.
- A high probability that a possible trading scenario begin to happen.
The disadvantages include the need for continuous monitoring of the market situation (it’s time-consuming).
Let’s Sum Up
All three strategies are theoretically sound, so they demonstrate good practical results. You will get even better results if you apply them together.
However, nobody can give you 100 percent guarantee that these strategies will work in every market situation. Use them at your own risk, or better yet, in combination with other methods of analysis.