FXSSI.Ratios
FXSSI.Ratios Screenshots (8)


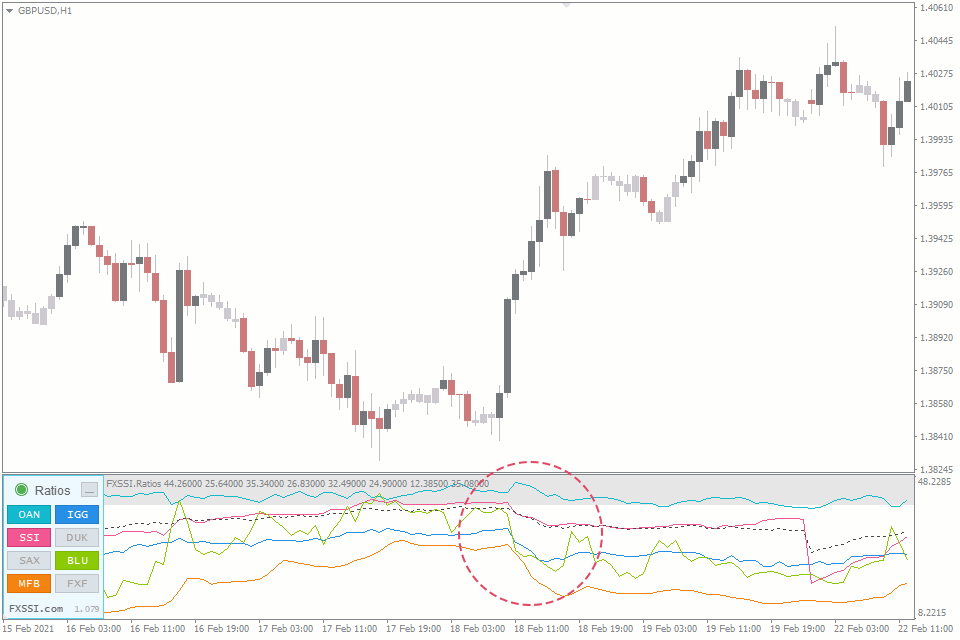
FXSSI.Ratios - Overview
Track market sentiment dynamics with the Ratios indicator.
Historical data on the buyers and sellers ratio allows you to analyze the key points on the chart in more detail and suggest where the price is going to move next.
The Ratios Indicator
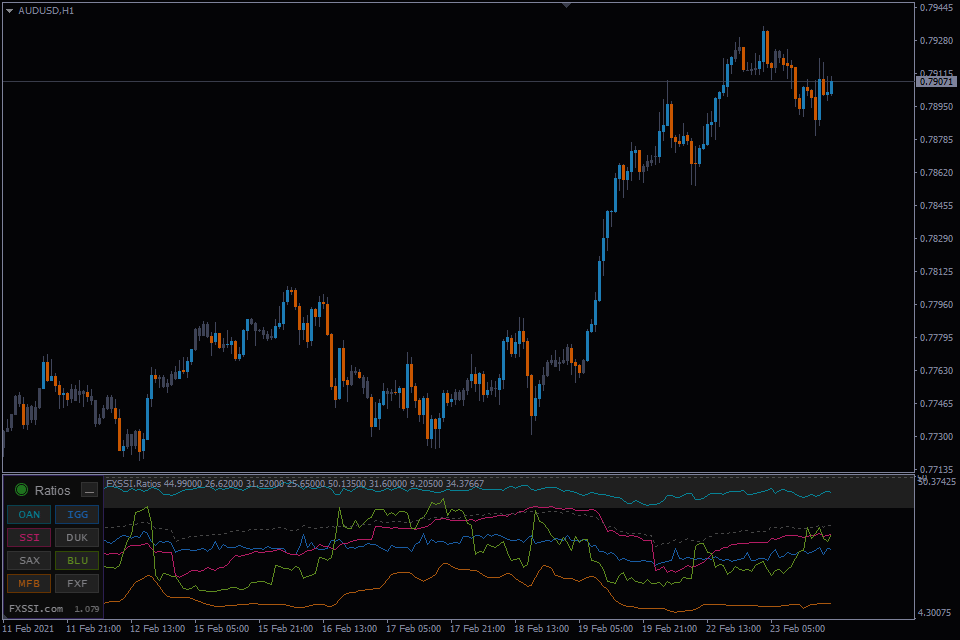
The Ratios indicator displays the ratio of buyers’ and sellers’ positions as a chart. The ratio data comes from several major brokerage companies and some services, such as ForexFactory.
The indicator takes into account only currently open trades, while the closed ones don’t affect it.
The given indicator provides data on open positions (i.e., client positioning) from 10 sources for 12 Forex pairs (these figures may change over time). Today, there are numerous sources of the ratio of positions, but we use only the most relevant of them in our indicators and tools.
The indicator is used for:
- Confirmation of the direction for your future trade;
- Determination of medium and long-term trends;
- Searching for manipulative price movements.
Also, the indicator is useful for novice traders, as it allows them to study better the mechanics of the market.
The Difference of This Indicator From the CurrentRatio, And Its Purpose
Unlike the CurrentRatio, the data of this indicator is presented as a chart that significantly enhances the efficiency of the analysis. It will become your invaluable assistant if you heavily rely on the ratio of client positioning in your analysis.
If you compare this indicator with the CurrentRatio displaying similar data, you’ll see that the Ratios indicator has a number of benefits.
It allows you to see various manipulative price moves in the past. Particularly valuable in the analysis of extreme levels and the indicator readings for the corresponding candlesticks.
By analyzing the history of the ratio of open positions, you can learn how most traders act in various market situations. Based on these observations, you’ll eventually develop your own patterns of behavior that can be applied in your future trading.
Why Is It Important to Analyze the Ratio of Positions?
According to a popular belief, about 95-99% of traders lose their money in the market, i.e., they trade at a loss. Therefore, trading in the opposite direction from most traders can be profitable.
This indicator was created particularly for such a quick assessment of the current sentiment of most traders.
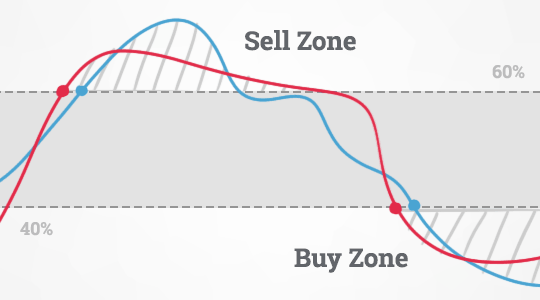
The image above shows the simplest method of analysis using this indicator. Sell zone – the SSI indicator is above 60%. Buy zone – the SSI indicator is below 40%.
If most traders go long, you should look for Sell opportunities. If most of them expect an asset to drop in price (go short), you should consider the Buy opportunities.
Trading With the Indicator
The basic idea of how the indicator works is not to open a trade in the same direction as most traders in the market do.
By following this simple principle, you'll increase your chances of making a successful trade.
Besides, when you trade against the market majority, you trade with a trend, since most of the trades are always open against the trend.
The Ratios indicator supports many analysis algorithms. Let’s consider some of the possible options.
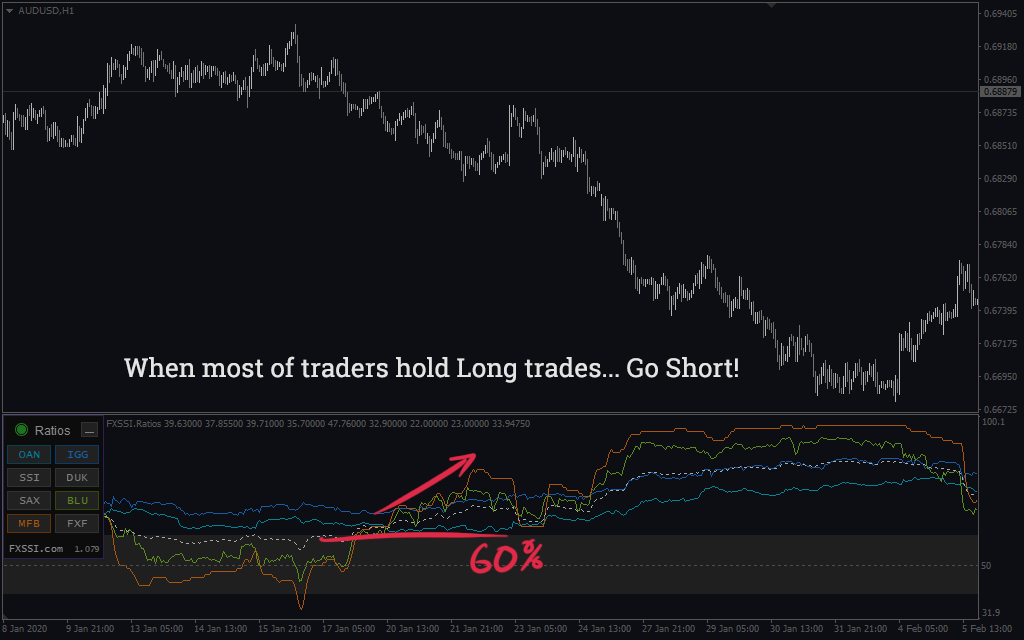
Long-term signal
The data of most sources have crossed the edge of the signal range. Several sources may stay within the range, but with a value of at least 50% (for Sell trades).
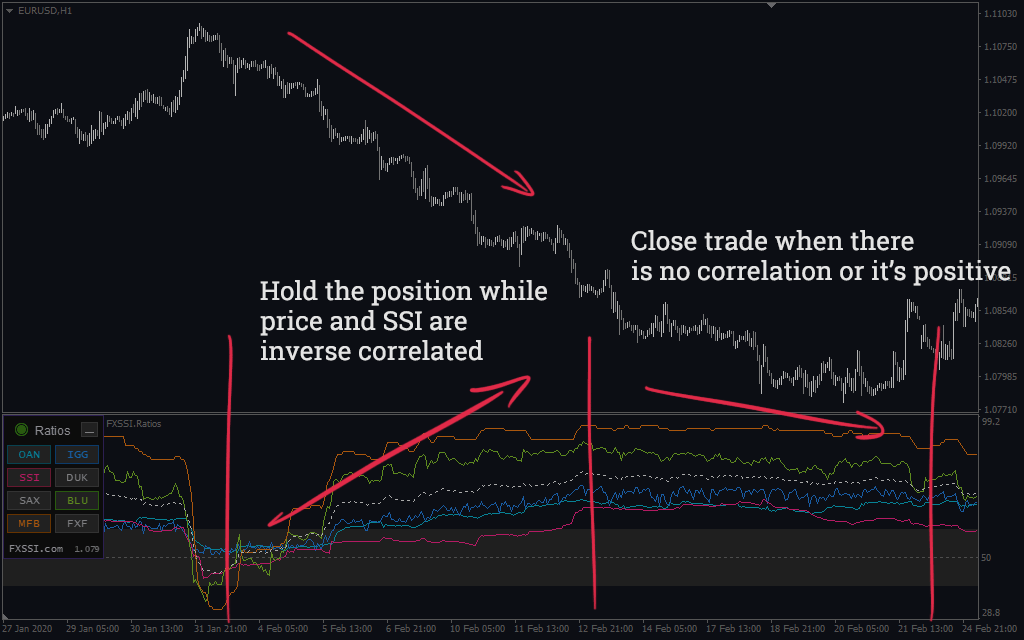
Correlation of the price and client positioning
As long as the price movement inversely correlates with the indicator of open positions, you may hold your trade open.
If a direct correlation appears between the price and the Ratio indicator, you should close your trade.
As you can see, the main idea is not to open a trade in the same direction as most retail traders do; however, if there is no such a majority, you can open a trade in any direction.
Indicator Features
The indicator displays historical data as a chart. The depth of the price history depends on the selected subscription plan.
We should note that low-capacity computers may not be able to display a high volume of data. In this case, you should go to the indicator settings and limit the historical data volume displayed.
Basic features of the indicator:
Quick access to data. Enable or disable data providers directly from the indicator window:
The feature is useful when you need to examine a specific data source in more detail. It is also possible to remove the button from the indicator panel in the settings.
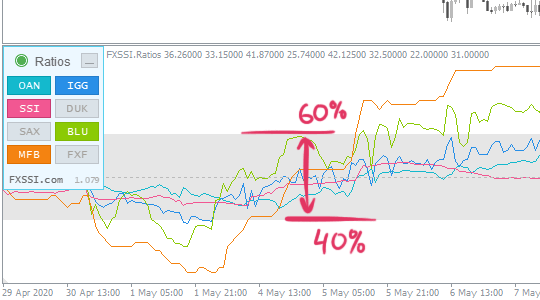
Signal range. Highlights the range between Buy and Sell signals.
You can set the height of the range on your own in the indicator settings. For example, if you set it to 40, the signal range will be between 40% and 60%.
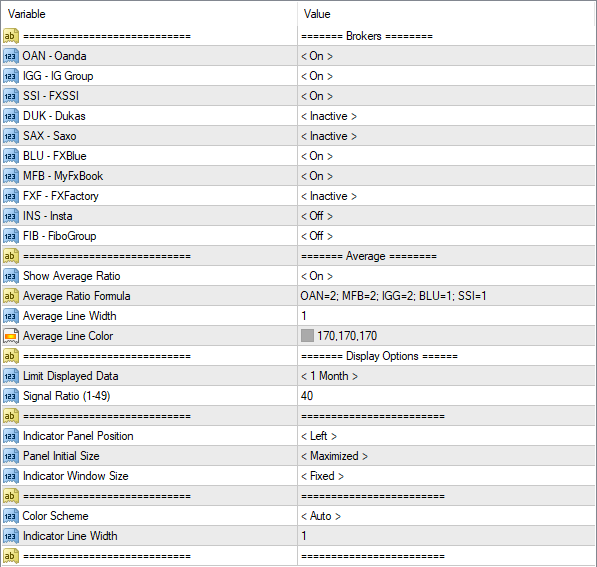
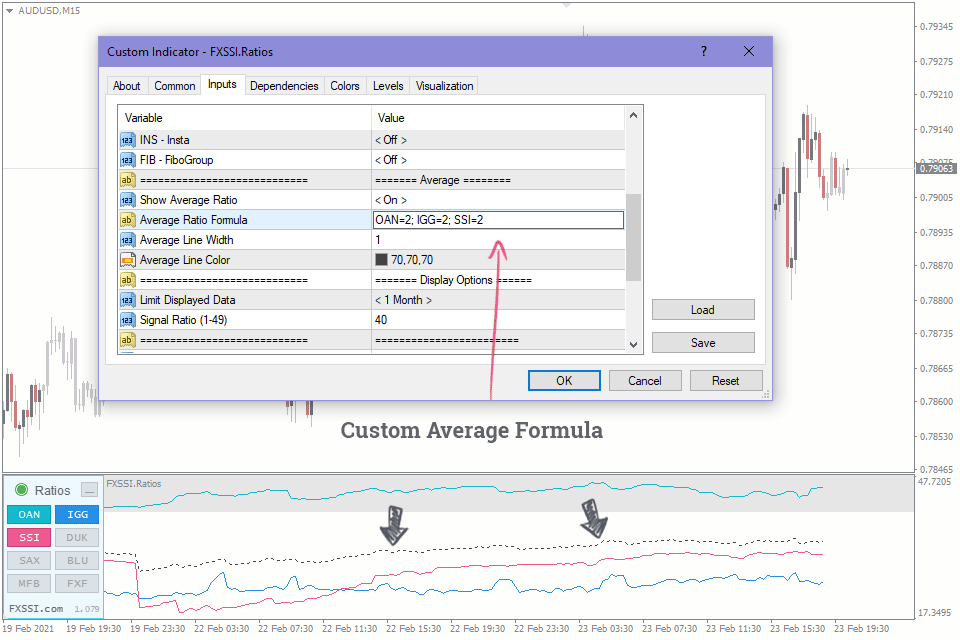
The custom formula for AVG (average value) – enter your own formula for calculating the average position ratio value.
Input format: OAN = 2; MFB = 2; IGG = 2; BLU = 1; SSI = 1, where
- "MFB" – three-character code of the source;
- "2" – the share of the source in the average value.
You can add or remove sources from the formula, as well as specify any weight coefficient.
Minimizing. You can minimize the indicator panel by clicking on it or set minimizing as default.
Auto settings. The indicator is equipped with a feature of automatic detection of color scheme and time zone.
For your convenience, we have implemented the Automatic Indicator Update system. Now you just need to restart your terminal to get the latest version. The indicator will inform you about it in a separate window.
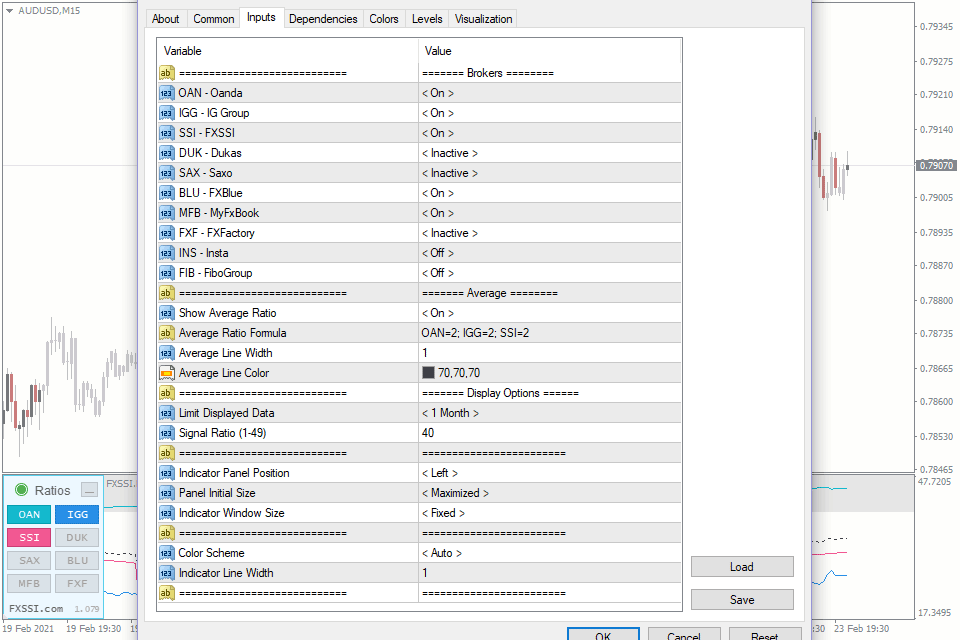
Indicator Settings
Brokers:
- "On" – when launching the indicator, the data from the selected broker will be displayed on the chart. The button on the indicator panel will be activated by default.
- "Inactive" – data from the selected broker aren’t displayed, but they can be enabled by clicking the button on the indicator panel.
- "Off" – completely disables the selected broker and the button on the indicator panel.
Show Average Ratio. You can use this parameter to disable displaying the average value on the indicator panel.
Average Ratio Formula. Specify the brokers and their weight in the suggested format to include them in calculating the average value.
Average Line Width/Color. Customizes the thickness and the color of the line that displays an average value.
Limit Displayed Data. The given parameter sets up the depth of the history the indicator attempts to display. Initially, the maximum depth of the downloaded history depends on the selected subscription plan. However, when you use the indicator, the data is stored on your hard drive and can be used to display the history exceeding the plan limits.
Signal Ratio. Specify the SSI value, above which the indicator will signal the Buy or Sell. You can specify the values from 1 to 49. If 40 is set, the Buy signal will be generated when the ratio of positions is 40 or less, and the Sell signal will be generated when it is 60 or higher.
Indicator Panel Settings:
- Indicator Panel Position – selects where to place the indicator panel on the chart;
- Panel Initial Size – by default, it maximizes/minimizes the indicator panel when you start your terminal;
- Indicator Window Size – sets the fixed or floating height of the indicator window.
Color Scheme. By default, the indicator automatically detects the color scheme depending on the chart background. If necessary, select the desired color scheme from the list.
Indicator Line Width. This parameter determines the width of the chart lines for all brokers.
How to add FXSSI.Ratios in MT4/MT5
The FXSSI.Ratios indicator is part of the "FXSSI Pro" package, which also includes several other professional indicators.
Follow the instructions below to install the "FXSSI Pro" indicators package to your MT4 terminal:
- Download the ZIP-archive with "FXSSI Pro" indicators by clicking the link at the top of the page;
- Extract the contents of the archive (indicator files and DLL library) to the MQL4/5 folder of your terminal;
- If the system offers you the File Replacement, click – Yes;
- Restart the MT4/MT5 terminal;
- Run the indicator by double-clicking its name in the MT4 Navigator;
- Check the "Allow DLL imports" box and click "OK";
- Go through the Authorization Procedure: click the "Authorize Link" that will appear after you first start the indicator, and sign in to your account;
- The indicator will be displayed on the chart;
- Adjust the indicator settings according to your needs: press CTRL+I, select the indicator from the list and switch to the "Inputs" tab.
If you have any difficulties while installing the indicator, please view the detailed instruction.


