Does the Ratio of Open Positions Work?
In this article, we’re going to talk about the ratio of open positions of traders (we will test them). This sort of information is not usually shared with the general public.


Before we get started, we would like to recommend you to read the following articles:
- What are the open positions of traders?
- Regularities in the Forex market.
- Playing against the crowd in Forex.
Test Parameters and Objectives
Objective 1: Assess the potential of the “trading against the crowd” strategy which is based on the ratio of open positions of traders.
Objective 2: Find the optimal formula for calculating the average value.
The current formula was defined, so to say, “by eye”. In addition, the average value is used in the informer installed by other webmasters on their websites. It is in our best interest that they get information of higher quality.
It doesn’t make sense to write the phrase “the ratio of open positions of traders” every time – let’s use the term “Ratio” instead of it further in the article.
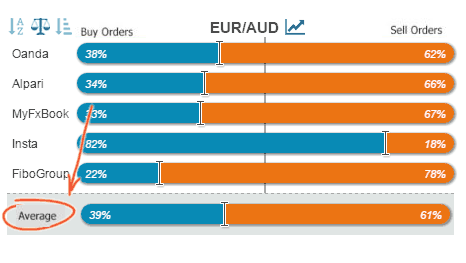
The Ratio is measured from 0 to 100% and refers to the percentage of traders who a currency pair.
Strategy: if most traders go long, we should sell, and vice versa. This strategy is explained by the speculative nature of the market meaning that the majority have to lose so that the minority can make money.
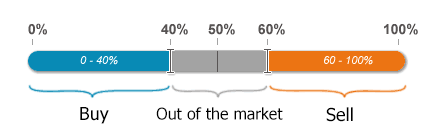
In most cases, we will buy when the Ratio is less than 40% and sell when the Ratio is more than 60%. However, in some cases, barrier to entry will be changed. The point is that the Ratio of less liquid brokers or currency pairs varies widely, so one has to filter it by increasing the barrier to entry. For example, buy when the Ratio < 30% and sell when the Ratio > 70%.
Range of the study: July 2016 – August 2017 (about 13 months).
Currency pairs: EUR/USD, AUD/USD, GBP/USD, and USD/JPY.
Timeframe: M30.
SL and TP = 50 points.
As always, we remind you that the tests are conducted under “hothouse” conditions (without taking into account spreads and commissions). Read more about the regularities (the link is provided above).
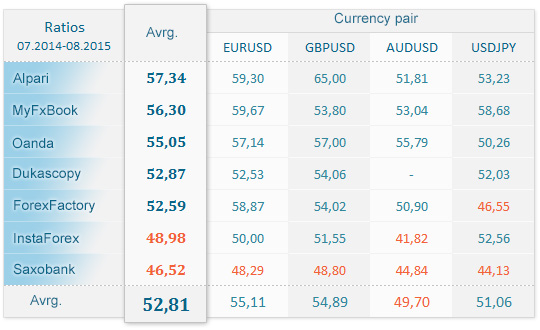
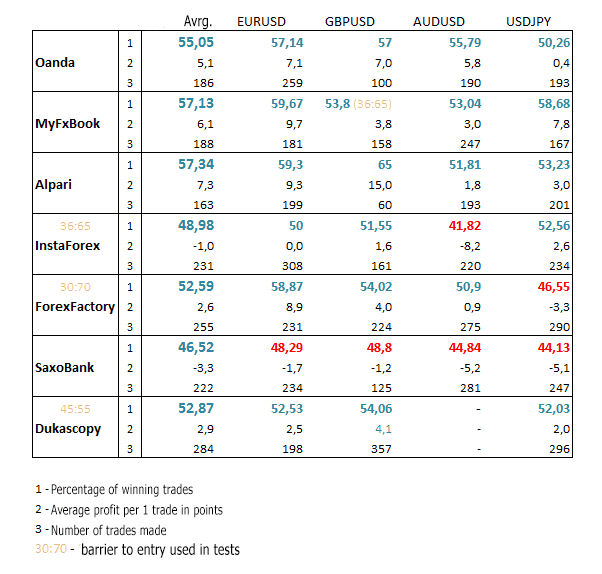
Summary Table of Results
Profitability of the strategy based on open positions of traders:
Here‘s another table with more detailed information – click here.
Conclusions Which Can be Drawn From the Table:
- The first (and the most pleasant) thing is that the Ratio actually works – at least, as compared with the results of classical indicators.
- There are three sources of data on the Ratio providing good-quality information: Alpari, Oanda, and MyFxBook. If we were asked to rank them by efficiency, Oanda would be ranked first, MyFxBook and Alpari would place second and third respectively. The fact is that Oanda can indicate “up” and will show it until the price goes up, but MyFxBook might lie.
- In addition, strange results were obtained for SaxoBank broker. The result is too negative to write it off as a margin of error. Most likely, there is an inverse relationship or, simply put, customers of SaxoBank do understand something. In any case, we shouldn't jump to any conclusions since we need to monitor the situation.
Actually, What if…
… we increase/decrease the size of SL and TP?
Let's try to identify some dependencies, for example, how the profitability will change while the value of SL and TP is changing.

While analyzing the chart, it becomes clear that small SL and TP are ill-suited to trading by the Ratio.
At that, if we set the values exceeding 40 points, we’ll obtain quite good results. We remind you that we used SL=TP=50 points during the initial tests.
Therefore, the optimal target for the Ratio-based strategy is 100-120 points. The potential is obviously lost outside these limits.
All this suggests that the Ratio generates medium-term signals.
This is why they should be carefully used in the intraday strategies.
… expand/narrow the barrier to entry
When is the right time to open a trade: when the Ratio is more than 51% or 65%?
The chart showing the dependence of the percentage of winning trades on the value of barrier to entry can help respond to this question:
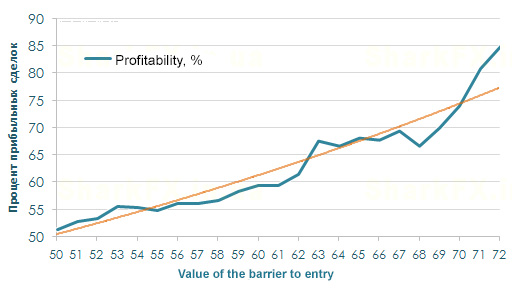
A linear relationship can be seen on the chart meaning that the greater is the Ratio deviation from 50%, the more likely the price will go against the crowd.
To be clear, “55” shown on the chart means that during the test, Buy trades were made with the Ratio = 45, and Sell trades with the Ratio = 55, etc.
Average Value
On the basis of the data received, the average value shown by this tool should be indeed revised.
Ideally, it should produce better, or rather more stable, results than data on a single broker.
To do this, we need to calculate the average value based on the data only on the most efficient brokers, which in our case are Oanda, MyFxBook, and Alpari.
After carrying out various optimizations and selection of parameters for EUR/USD, the best result was shown by the following proportions: Oanda – 40%, MyFxBook – 40%, and Alpari – 20%.
The results of the obtained average value for other currency pairs are as follows:
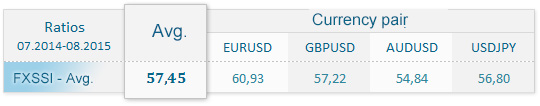
In general, we like the results, and, above all, they look stable.
In addition, we noticed an interesting feature:
Important! The average value, unlike the data on a specific broker, shows good results if you trade from the mark of 50% (buy if the Ratio < 50% and sell if it is > 50%). Here are the results of the tests:
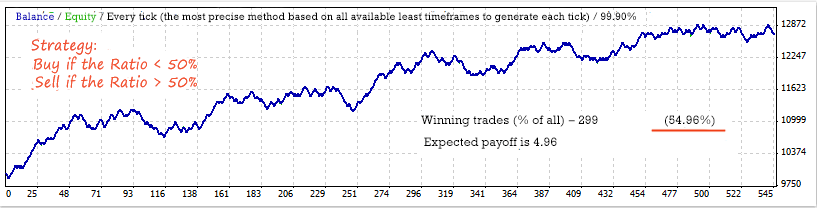
This means that the average value is perfect as a “direction vector”.
That is, you look at the average value and try to open trades mainly by vector.
Places where you can view the average value:
- You can view it in the basic tool along with the data received from other brokers.
- You can view it in a widget in the sidebar at the bottom of the website.
- You can also install the informer somewhere on your website/in your blog and view the data there.
Let’s Get Things Clear in Our Minds
The tests proved that the ratio of open positions of traders really has a profitable potential.
Here are some recommendations for use:
- The best data are received from these brokers: Alpari, Oanda, and MyFxBook.
- The Ratio begins to work almost immediately after moving away from the 50% mark. At the same time, the following dependence was detected: the greater the deviation, the higher the probability that the price will respond “in the right way”.
- The optimal SL and TP for a future trade are within the limits of 100-120 points.
- The average value for the most efficient brokers is good enough to be used as a direction vector.
- The more liquid is the currency pair, the better. Supposing that you have the following data on NZDCHF: 30% of trades are long and 70% of trades are short. The logic suggests that you should buy but imagine that there are two trades behind this data: the first one is 0.3 lot, and the second one is 0.7 lot. Do you think the market will take this information into account?
If you have the question “Why does the ratio of positions work?” arisen in your mind, we’ll try to answer it.
The fact is that the financial markets are currently a tool used to move money from small to large market participants. Accordingly, the strategy of trading against the crowd or following the market maker is the only working strategy of all possible ones. In all other cases, you simply don’t realize that you’re trading against the crowd when you make your money.
Finally, we would like to hear your opinion and learn about the practical results of application of this strategy. Feel free to write even if the results are not quite good.
P.S. Appreciate someone else's labor. If you publish or copy the content, make sure to specify the source, otherwise such projects will be lost among the hundreds ones of lower quality.


