RSI vs CCI vs Williams %R - Indicators Performance Study
Today, we’re going to test 3 indicators: Relative Strength Index (RSI), Commodity Channel Index (CCI), and, at our reader's request, Williams %R indicator. What do they have in common, and why have we decided to test them together?


We have already crash-tested a Moving Average indicator and tried to find some profitable regularities when using it. We want to remind those who can’t remember/didn’t read the following: the success of the trade made using the Moving Average indicator was 50.94%, which is close to flipping a coin.
Back to our today’s participants: RSI, CCI, and Williams %R indicators.
All these indicators are oscillators, meaning that their value always oscillates around some central point (axis). Take a look at this picture:
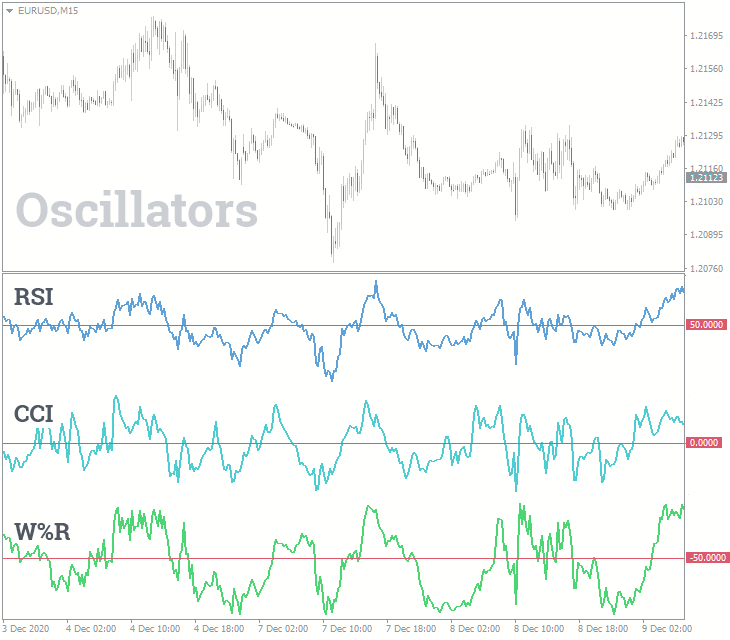
Accordingly, these indicators generate similar signals. More specifically, they signal an overbought or an oversold state of an asset. Overbought and oversold condition is a reversal trading strategy, i.e. trading against the trend.
Now let’s discuss a bit of theory about testing methods.
Don't like theory and take our word for it? If so, go right to the test results.
How and What Will We Test? RSI vs CCI vs Williams %R
Objective: determine the effectiveness of RSI, CCI, and Williams %R indicators.
In the previous study, we focused on various currency pairs. Since most of you trade only EUR/USD, this time we would like to analyse the effectiveness of these indicators on different timeframes for one currency pair, but in more details.
Range of the study: 2012-2015.
Currency pair: EUR/USD.
In addition, we conduct tests without taking into account spread and commissions. This enables a more accurate determination of the indicator's potential. If you read our other articles, you will understand why we do so.
Test #1 – Relative Strength Index (RSI)
On its own, this indicator is very popular today, and the basic strategy for its use is to identify overbought/oversold levels.
The value of the RSI indicator always ranges from 0 to 100, and the signal to enter a trade is generated when its value is beyond the mark of 70 for a short trade and 30 for a long trade.
Description of the strategy under test:
- Sell when the RSI crosses 70 downwards.
- Buy when the RSI crosses 30 upwards.
- Close a trade at a fixed SL/TP (30 points).
- Indicator period: 14.
- Timeframe: M30.
Results of the test:
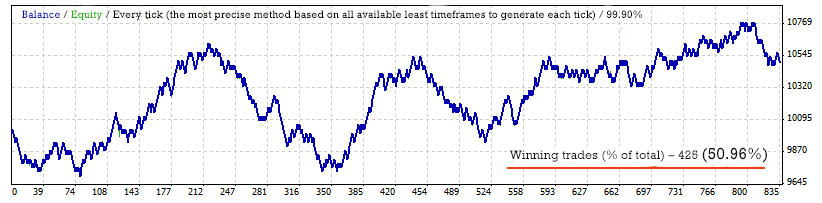
Conclusions: The effectiveness of the RSI indicator is 50.96% meaning that only 50.96% of all open trades were winning and 49.04% were losing.
See the results for other timeframes at the end of the article.
Test #2 – Commodity Channel Index (CCI)
The second, but also a popular indicator is CCI. It is traded the same way as the RSI, and the only difference is the range within which the indicator oscillates.
Description of the strategy under test:
- Buy when the CCI crosses -100 upwards.
- Sell when the CCI crosses 100 downwards.
- Close a trade at a fixed SL/TP (30 points).
- Indicator period: 14.
- Timeframe: M30.
Results of the test:
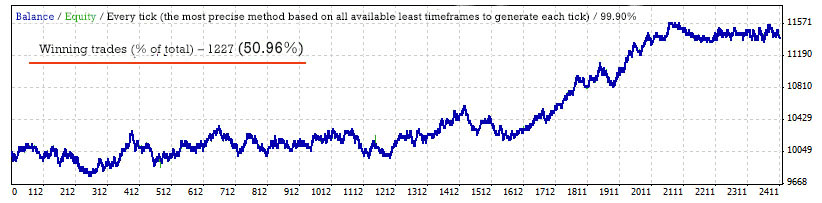
Conclusions: The result is the same – 50.96%. Please note that the number of trades opened based on the CCI indicator with the same parameters is much larger than that of the RSI indicator. More market entries produce more noise.
Test #3 – Williams %R
The last indicator we’re going to test is Williams %R, which also signals overbought/oversold areas, just like the previous two.
The range of oscillations is between 0 and -100.
Description of the strategy under test:
- Buy when the Williams %R crosses -20 upwards.
- Sell when the Williams %R crosses -80 downwards.
- Close a trade at a fixed SL/TP (30 points).
- Indicator period: 14.
- Timeframe: M30.
Results of the test:
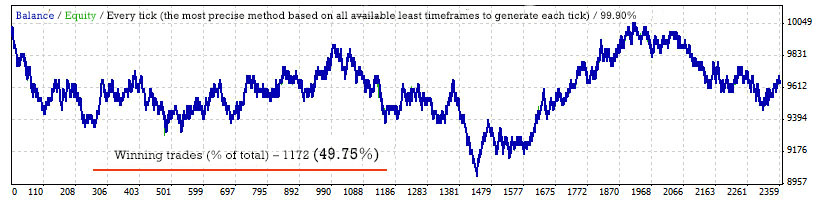
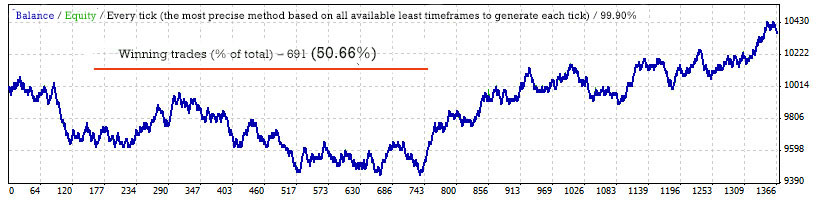
Conclusions: The Williams %R indicator showed the result of 49.75%, which doesn’t mean that it will always incur loss – it's just that a margin of error was negative.
Summary Table of Results
We will test the indicators for all other timeframes to get a more complete picture.
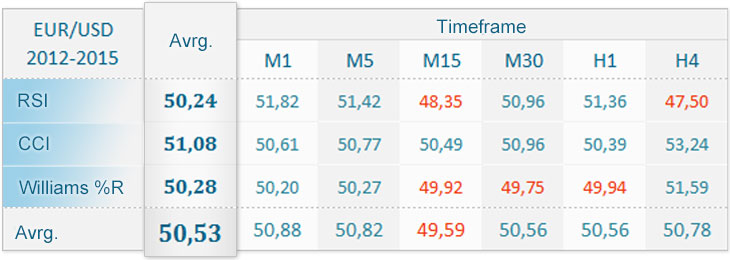
Let's analyse the table:
- Equity chart trends upwards on low timeframes (M1-M5). Here is an example. However, this growth is most likely related to the reversal effect but not to the performance of the tested indicators on these timeframes.
- The maximum and minimum values were obtained on the highest timeframes. This doesn’t suggest that there are better signals on these timeframes, but it's more than likely that this is due to a small number of trades (the margin of error has increased).
- And the last interesting point: what would happen if you enter the market when all the indicators signal at the same time? According to this article, the performance should increase, but that wasn’t the case. Here you can see the result of the tests. This indicates that the effectiveness of the indicators is about 50%, since using them as filters is not helpful.
Verdict

The testing of the RSI (50.24%), the CCI (51.08%), and the Williams %R (50.28%) indicators showed that these indicators don’t have any profitable potential, and their practical usage is pretty much meaningless. This is why we're sending them to the “cemetery of indicators”.
We cannot say that we are surprised by the results. As we have already answered one of our readers, “We won’t believe it until we see it ourselves”. This way, we will also help you make sure that these indicators are meaningless.


