Regularities in Forex Trading - Part 2
Forex regularities can improve your trading experience by adding to the stability of your income if you know where to look. But where to find them? And how does one identify a regularity in the Forex market?


Today, we're digging even deeper into Forex regularities. We've covered the basics here.
And this article covers two main topics:
Where to look for regularities?
Believe it or not, one can find regularities in the Forex market almost everywhere.
Although, we cannot always find them, since they're often hiding behind spreads, commissions, or, there's just not enough time to test them. Few people can name at least one tested and working regularity.
In order to help you with the search and to point you in the right direction, we've put together a list of "places" where you can look for regularities.
In addition, we have outlined their possible efficiency (percentage of winning trades versus losing trades).
Let's divide them into three groups.
Regularities in technical analysis (visual)
- Indicators (50-52%). Most indicators use a formula that simply cannot predict anything, and sometimes the indicator signal even lags behind the price itself. Hence the lowest rate of winning trades. At the same time, indicators are easy to test, which allows you to quickly weed out non-working ones.
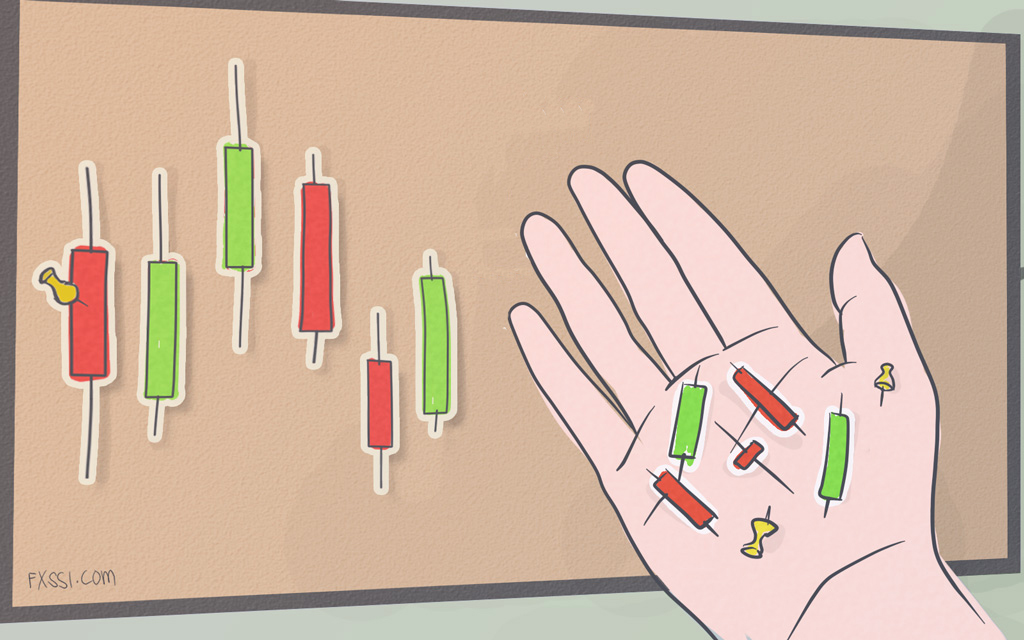
- Sequence of candlesticks (51-52%). All regularities are connected to the sequence of candlesticks, for example, there's a 51% probability that a bullish candlestick is going to be followed by a bearish one, etc. They give a better signal than indicators, because they are not derived from the price (they are the price itself). And just like indicators, they are easy to test.
- Levels, channels and trend lines (51-55%). This includes patterns based on support and resistance levels, round levels, price channels, and trend lines. The only problem is that these technical analysis tools are very difficult to formalize.
- Patterns (51-55%). Sometimes they don't work, and sometimes they work so well that they exceed all expectations. But patterns are way more complex than levels. In addition to being difficult to test with the help of an Expert Advisor, it is also difficult to correctly recognize them on your own. By the way, one more important thing about patterns: you need to know them and always take them into account, and keep statistics on their effectiveness throughout your career.
Regularities in Market Information (real data)
- Option levels (51-55%). They have the smallest impact on the price among all exchange instruments. In addition, they are difficult to analyze, and most people simply do not have access to this information.
- Open positions ratio (53-57%). These data are highly effective and are publicly available. Open positions in manual trading show better results than in automated trading. This is explained by the fact that if you think carefully before opening a deal, then a lot of unnecessary entries are eliminated.
- Cluster volumes (53-57%). They are slightly worse than order books, since volumes represent past information, while order books show future information.
- Order book (55-60%). One of the most powerful sources of regularities (in our opinion), although you can test them only manually, and this will take years.
Miscellaneous.
- Various features (50-53%). For example, such as this one, or some kind of money management. All these regularities are mainly related to the method of opening / closing a position.
- Eagle-eyed. (50-70%). Observing the charts for a long time, you acquire a "gut feeling", and it's based not on intuition, but on the gained experience. You have just seen a similar situation many times and can now predict how this situation might end.
Bear in mind that by using several regularities at the same time, you can increase the chances of a successful trade (see the formula). With a competent approach, you can achieve 60-70% of winning trades.
Regularity 1. Reversal effect
We have already mentioned this effect in another article.
While testing various approaches to trading, we accidentally stumbled upon one regularity and called it the “reversal effect”.
This regularity is part of the "Sequence of candlesticks (51-52%)", and it's very simple in its essence:
If the previous bar is bearish, then the next one is more likely to be bullish. And vice versa.
It works exclusively on low timeframes: М1 – М15. This effect will be lost on higher timeframes.
As we've mentioned in the article about conscious trading, you always need to know why things happen this way or another. Thus, a possible explanation for this regularity: most ordinary traders follow the reversal trading strategy, and low timeframes are the only place where they can somehow influence the price. The price moves against ordinary traders on higher timeframes, so the effect gets lost.
Let's take a look at the testing results of this regularity:
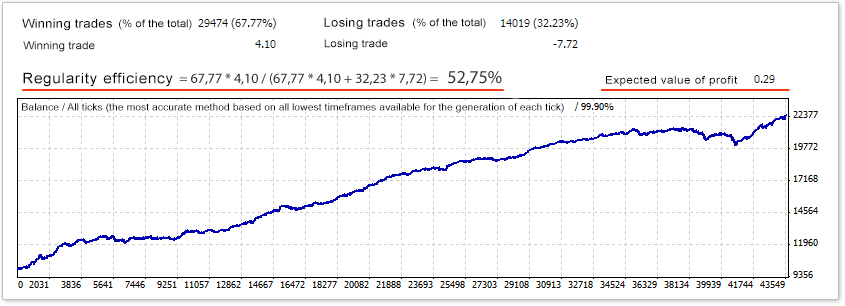
Regularity efficiency: 52.75% (is calculated using this formula).
Average profit per trade (profit factor): 0.29 points (~ 3 pips).
Commentary: as you can see, you cannot evaluate a regularity only by its efficiency. The average profit per trade is also an important parameter.
In this case, the regularity appears quite often, but its effect extends to a very short period of time after the opening of the trade.
In other words, it can bring as little as 3 pips on every trade, which in most cases will not even cover the spread amount.
But such regularities are also important. Let's take a look at a more interesting one.
Regularity 2. From the Market Sentiment group
If the first regularity has referred to technical analysis, then this one refers to real market data. Now you will see all the difference:
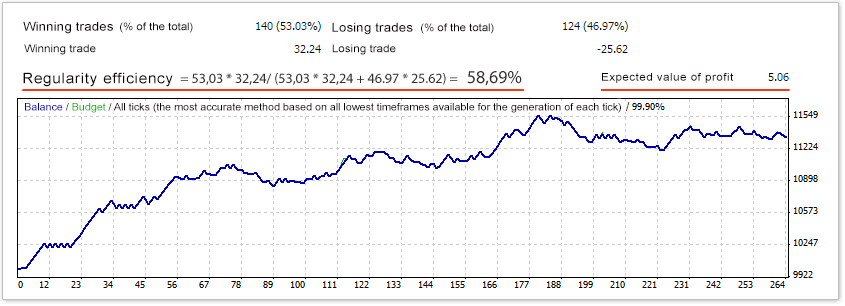
Regularity efficiency: 58.69%.
Average profit per trade: 5.06 points (~ 50 pips).
Commentary: as you can see, the robot makes entries less often, but more accurately. In addition, the effect of this regularity lasts longer.
All this results in a pleasant average profit per trade.
Conclusion
In the search for regularities, it is important to also distinguish them by their temporal effect.
Most of the regularities that we find will have short-term effects, as in the first example. But you will also come across the ones that act for a longer period of time, like in the second example.