How to Draw a Trend Line Properly?
Most traders use a trend line (in the future referred to as “TL”) to analyze and make trading decisions, making TL an essential tool for technical analysis.


We believe that the simpler the technical analysis tool, the more traders will take it into account during their trading, and the higher the probability that the price will interact with it (in our case, with TL).
It may be concluded that the chance of receiving a profit or loss as a result of a particular trade partially depends on how properly a trend line is drawn.
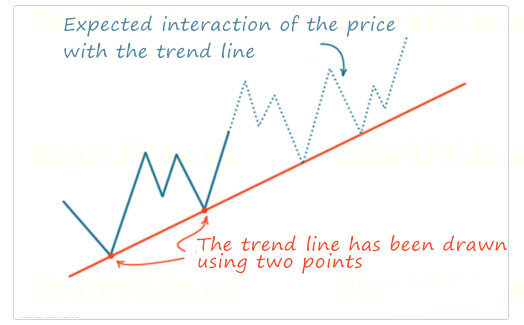
Usually, TL is drawn using two points, and the price is expected to behave roughly in this way in the future as shown on the chart:
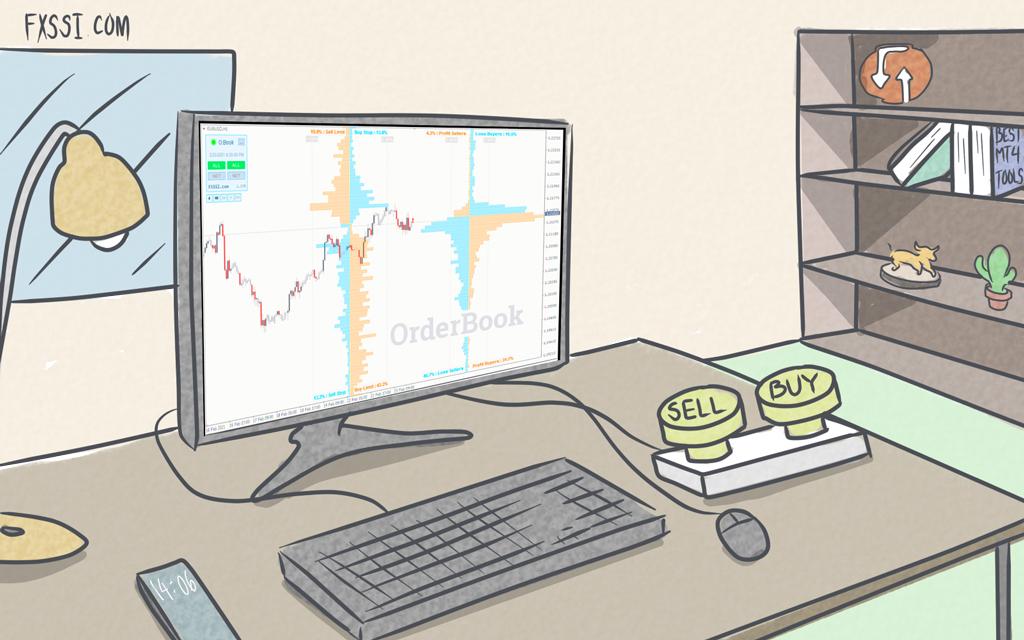
We use Trendlines Indicator for trading towards a trend, but there are other trading strategies based on the breakout of this line.
How to Draw Trend Lines Correctly on a Forex Chart
Here is a list of the recommendations and the major mistakes related to drawing a trend line:
- Trend line should be drawn from the outside of the quotes – through lows or highs. If one compares it with a mathematical line, which is in the middle, trend line acts rather as a visual support than as a mathematical indicator.

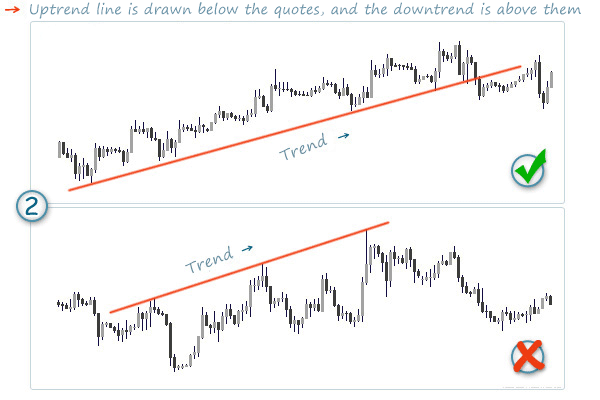
- Uptrend line should be below the quotes, and downtrend line above them. By following this rule, you will protect yourself from trading against the trend.
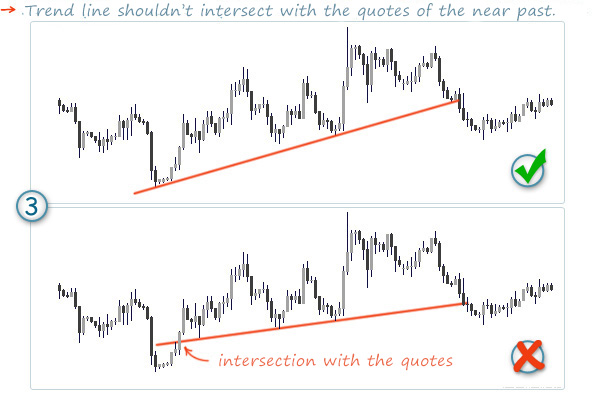
- Trend line shouldn’t intersect with the quotes of the near past. If it does, traders won’t take such a TL seriously, so it doesn’t work.
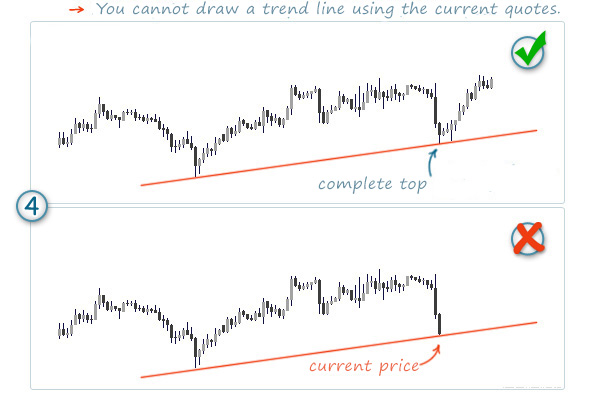
- Trend line cannot be drawn using the current price. It’s a very common mistake when novice traders rush to draw a TL through a not yet complete top/bottom.
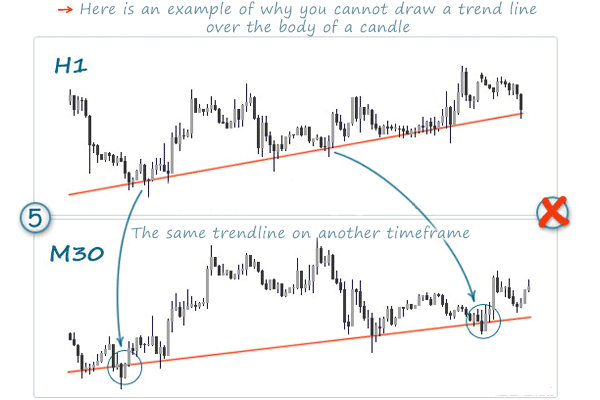
- Trend line should be drawn using the tails of candles, but not their bodies, since body of a candle might vary significantly after switching to another timeframe. In addition, we draw a TL to identify the points of rebound – you will agree that it’s somehow incorrect to “rebound” from a candle body.
Other Factors Affecting the Quality of a Trend Line
- Slope of a trend line is a subjective concept, because the slope is not the same when a timeframe changes and measuring the angle is an impossible task. However, if the slope is too steep, and you can see the price failing to keep this pace up, delete the line from the chart. Too gentle slope is not necessary as this kind of trend can be equated with a flat market.
- Naturally, the higher the timeframe, the better. It is best to begin considering a trend with H1, because 20 trends may replace each other for one day on smaller timeframes.
- Speaking about the number of cases in which the price touches a trend line, the strongest signal and the probability that trend will “stand out” occurs at the point of 3rd touch – there is even a strategy based on it. Besides, many people say that the more touches, the stronger is a trend. However, we cannot deny the fact that every next touch brings us closer to the end of the trend.
By adhering to these simple recommendations, you can be sure that you have correctly drawn a trend line, which is seen by everyone and really works.