Moving Average Indicator Crash Test
In this article, we’re going to test a classical Moving Average indicator.

We believe that particularly everyone knows it and many also use it in their trading. However, have you ever wondered how effective it is and what the chance is that a trade will be successful?
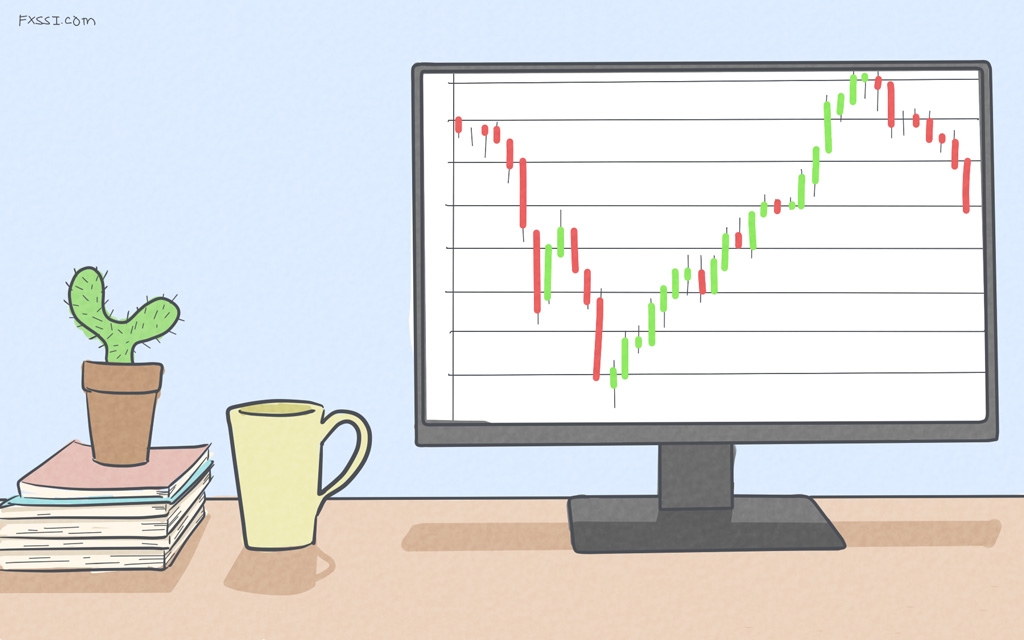
Take an attentive look at the chart below. Which Forex patterns can you see? What do you think of the major trend direction and the name of this currency pair? No peeking!
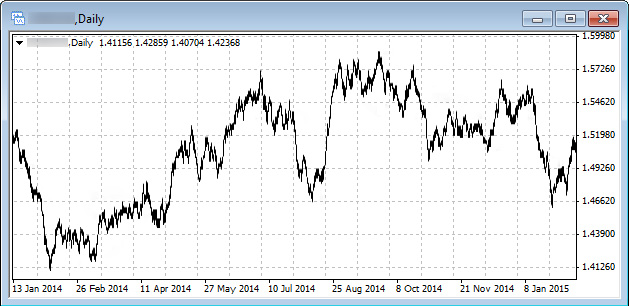
We hope that you have carefully analyzed everything and answered the questions. If so, now you can look at the answer.
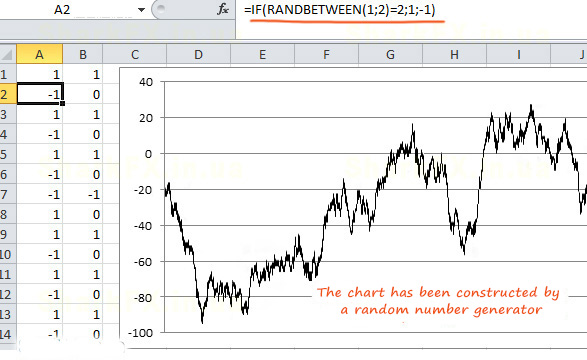
Truly speaking, the chart has been constructed by a random number generator in Excel and carefully disguised to resemble MT4 terminal window. We're not kidding! “Wandering” of a randomly chosen number between (+1) and (-1) will constantly generate a picture that looks very similar to the price charts.
What's this got to do with the study of moving averages?
If using moving averages yields virtually the same random results, it will serve as direct evidence that these averages don’t work.
Study Preparations
One needs to leave only price fluctuations (chart) of all the factors affecting the indicator performance to better assess the effectiveness of moving averages. In other words, we need to exclude spread, commissions, swap, and slippages that act as an unnecessary noise in our study. Therefore, we have created ideal conditions that cannot exist in nature but this is the testing that will enable us to identify the potential of this indicator.
Naturally, prices must be of high-quality. The next experiments use tick prices that allows for 99.90% of the modeling quality.
Objective: Determine the efficiency of the Moving Average indicator. At that, the effective indicator is the one that generate profitable signals with a probability of at least 53-55% given equal Stop Loss (SL) and Take Profit (TP). Otherwise, if we include commissions, spread, and swap in our study, the indicator will result in losses.
We have chosen three most popular trading strategies among many that are based on moving averages (MA) for testing with the help of trading robots.
Benchmark Study
Let’s test a robot that will open Buy and Sell trades where TP=SL in a random manner. We’ll compare the obtained results with the chart constructed by a random number generator in Excel. Ideally, we should be able to have 50% of winning trades of which 50% are Buy trades, and 50% are Sell trades. Here are the results:
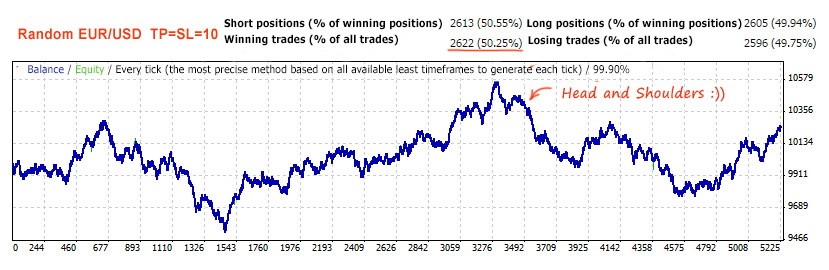
Looks like that chart in Excel? Pretty much. It means that we’re on the right track. We even managed to make some money by randomly opening trades. The primary objective of this test is to verify that there is no noise and to compare itself with the next tests of moving averages.
Study No. 1 – Simple Crossover of Moving Averages
The first and the most popular trading strategy based on moving averages is a crossover of moving averages.
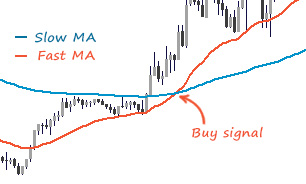
Market entry signal is generated when fast MA crosses slow MA. Therefore, we should buy when the fast MA is above the slow MA and sell when the fast MA is below it.
At that, market exit based on this strategy can be of two types: it can be based on the fixed SL/TP or when the reverse crossover occurs.
At that, it’s right to test market entry and exit based on the MAs crossover but the fixed SL/TP is more preferable for us. Besides, if market entry doesn’t yield any positive results, market exit won’t make any difference.
An Expert Advisor with three variables was developed based on the above described strategy. Let’s select optimum values in a range:
- SL=TP in the range of 10 to 100 points.
- 10-60-period Fast MA.
- 40-100-period Slow MA.
So, when the optimization has been completed, it turned out that the most stable parameters were the following: SL, TP = 40 pips; FastMA = 40-period; SlowMA=80-period.
Now we’re going to test the given Expert Advisor on another (not optimized) currency pair with the parameters specified above.
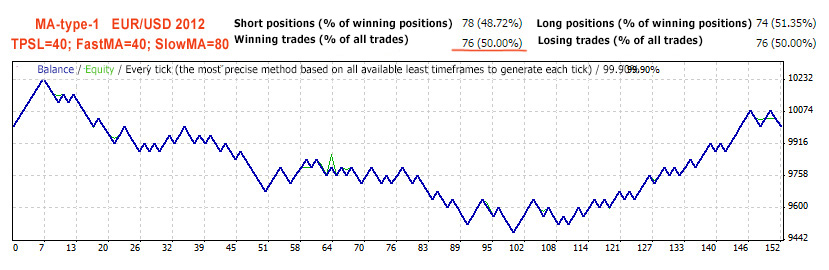
The probability of a successful trade based on the Strategy No. 1 is 50%.
As we suspected, optimization is only a curve-fitting of parameters to a certain time span. By using optimized parameters for a forward test, we have obtained zero results. Our opinion is that profitable regularity doesn’t need to be optimized.
Besides, other tests have shown that the type of MA and timeframe have had little influence in the results.
Study No. 2 – Crossover of Two MAs With an Additional Filter in the Form of a Long-Term Moving Average
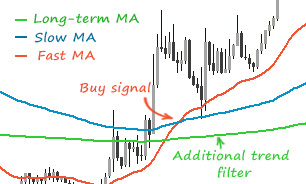
We add an additional filter which must exclude counter-trend market entries to the simple crossover.
Market entry signal is generated when the fast MA crosses the slow one with all three MAs facing in the same direction. See the picture on the right side for more details.
As we have already defined above, optimization of parameters doesn’t give us anything, so we cannot see any point in launching a long-term optimization. Then let's go straight to testing using standard parameters:
- SL=TP = 30 points.
- Fast MA = 20-period.
- Slow MA = 40-period.
- Long-term MA = 150-period.
Now we’re going to test the given strategy:
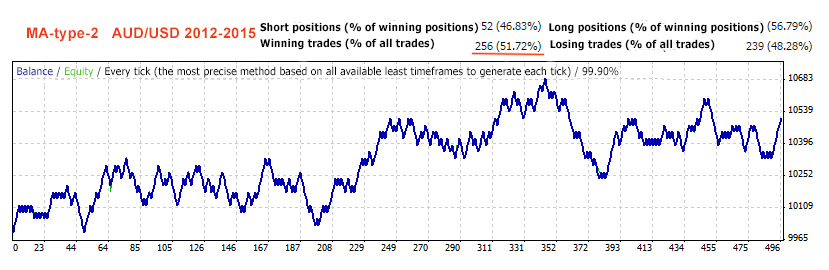
The probability of a successful trade based on the Strategy No. 2 is 51.72%.
Percentage of winning trades has exceeded 50 by as much as 1.7%. However, this percentage easily turns into a negative one in the real world where there is spread, commission, and swap.
Let’s proceed to testing the last strategy.
Study No. 3 – 200-period MA as a Support/Resistance
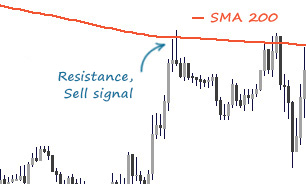
The oldest classical strategy. 200-period moving average which “symbolizes" 200 working days per year. It is used as a very strong support or resistance. There is another version of this strategy when a trade is opened upon breakout of this line. In any case, we need only one test, since these strategies are mutually exclusive.
Results:
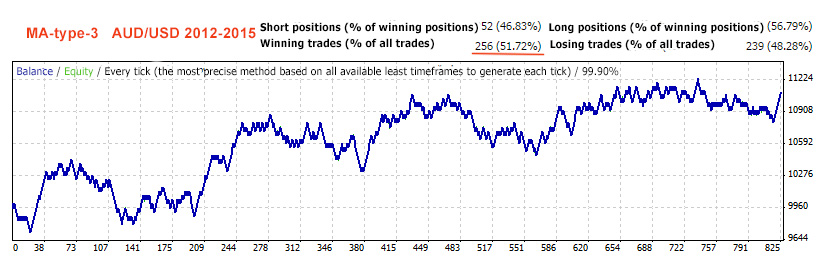
The probability of a successful trade based on the Strategy No. 3 is 51.70%.
No luck again. This latest study proves that no matter how you customize MAs and what you do with them – it will always be no more than “heads" or “tails".
Summary Table of Results
Let's collect some more statistics and put all the results in the table:
As shown in the table, the average probability of a successful trade is almost 51%. We would easily write this 1% off as a margin of error.
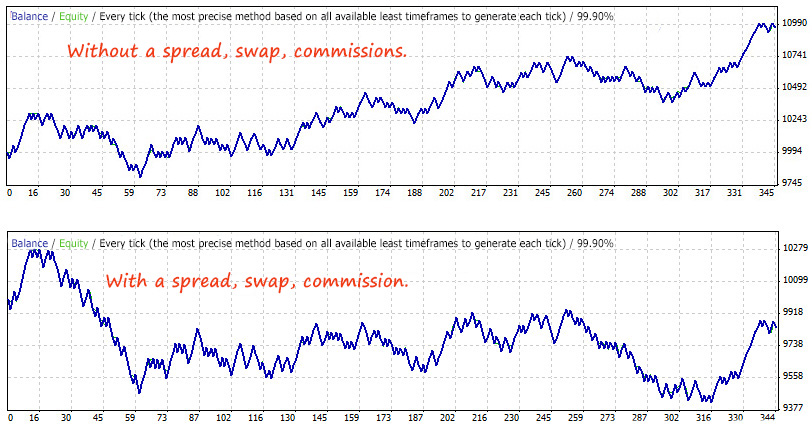
It’s good to show what will happen if we use real spread and commissions in these studies. For example, the second strategy for the Yen has shown the best result. That’s what will happen if we include spread and commissions:
Verdict

The study has shown that the Moving Average indicator has no any positive (profitable) regularities and its performance will not be much different from the usual flip of a coin.
Perhaps someone will say that these tests are pointless, because one should have added a filter to identify a trend since trading with MA is possible only when there is a trend in the market.
However, if you have such a unique filter that identifies a trend, why do you need the MA that generates random trading signals? Just open a trade towards the trend, and that's all.