SSI in Forex Trading - Everything You Need to Know
Among all available market sentiment indicators SSI is the easiest to understand and, as a result, the most popular. Is it that effective? Let's discuss.


SSI or market sentiment is the buyer-to-seller ratio that has developed in the market at the moment. It can be represented as a percentage of the number of trades or their lots. Please note that already closed trades do not affect this indicator.
The main algorithm behind the analysis of this indicator lies in opening trades in the direction opposite to most traders.
What does the SSI actually show?
As we’ve mentioned at the beginning of this article, SSI shows the percentage of buyers and sellers.
But what kind of buyers and sellers are they?
After all, we know that any trade in Forex involves two participants. If you’re buying, then someone else is selling to you. So, how, in this case, can the ratio of buyers to sellers be any different from 50 to 50?
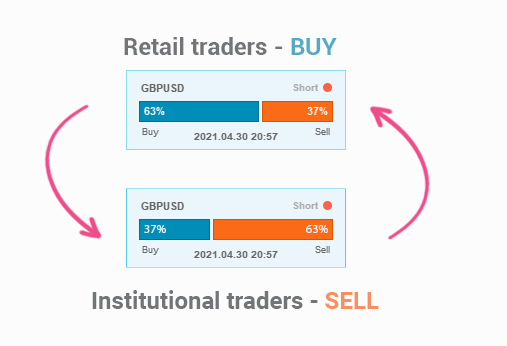
The thing is that the positions ratio that we are talking about is the ratio among retail traders. That is, the number of commercial and professional participants is excluded from this indicator.
Thus, SSI shows not just the ratio of buyers to sellers, but the ratio of retail buyers to retail sellers.
So, how are retail and professional participants separated from each other? Most of the position ratio sources available on the Internet are brokers and services that deal exclusively with small retail traders.
It’s also fair to say that the aggregate position of institutional players mirrors the positions of retail traders. This is the statement that underlies the idea of trading using position ratio.
By trading in the opposite direction to the majority, you automatically trade in the same direction as professional market participants. And the latter, according to statistics, are far more successful than retail traders.
There is no centralized location for Forex, so where does market sentiment come from?
That's right, Forex is an over-the-counter market. Therefore, there is no unified source of the positions ratio for the entire Forex market.
Usually brokers act as a source of SSI, since they have access to their own client positioning base. In addition, projects that provide services for monitoring accounts or copying trades also have data on traders' activity.
We gather the data on positions ratio from 6 large brokers and 4 services for our FXSSI instruments.
Can brokers manipulate data?
Most traders are suspicious of brokers. So, it’s only natural to experience some fear about brokers manipulating the data on the positions ratio in their attempts to mislead retail traders.
Thus, it appears to be difficult to get a definite answer to this question. Such a deceitful broker would clearly be interested in hiding this information from the public.
What can we do about this?
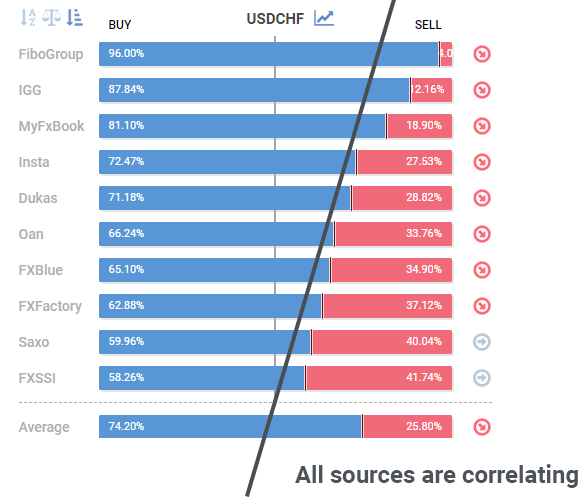
Upon analysing several sources, we will notice some correlation between their data. If a supplier is inversely correlated or not correlated at all, this will indicate possible fraud.
We haven’t stumbled upon such cases yet.
It also brings us to the conclusion that traders in general display similar behavioral patterns. And it doesn’t matter where you look at the SSI indicator, its overall readings will be similar regardless of the broker.
Can you trust the positions ratio in trading?
Let's start with the fact that the market sentiment analysis (positions ratio is one of the studied indicators) can now be distinguished as the third type of financial market analysis. In case you forgot, the first two are: Fundamental and Technical Analysis.
However, it’s rather unfair to consider it to be only the third one, since the market sentiment is exactly what drives the market from the very first day of its existence.
Thus, the first and major factor that determines what is going to happen in the market at any moment is the trader and their actions. Please mind that “trader” in this case implies any market participant.
It's funny how seriously we sometimes take certain things and perceive them as well-established trading systems. Let’s take a look at support and resistance levels, for example. These are, in fact, just psychological levels. There is nothing in the market to prevent the price from breaking through a resistance level. If a significant number of traders thinks the price should go higher, it will go higher.
If we dig even deeper, Technical and Fundamental Analysis actually study the same market sentiment, but each applies its own lens.
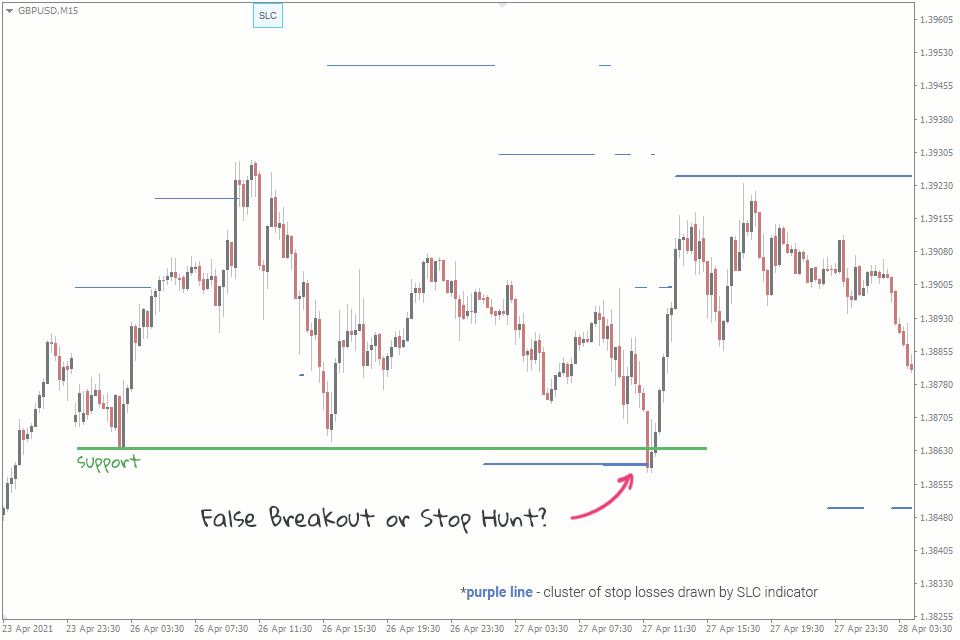
For example, by analysing any false breakout of a support or a resistance level, we will almost always notice a cluster of stop orders that were executed by this very breakout. If we take a look at this using technical analysis, this is a false breakout, but if we take into account market sentiment, it is stop hunting.
As a result, we can safely assume that the use of SSI in trading is well-grounded. The quality of the SSI source might be questioned, but this is a topic for another day.
So, does the market play directly against the crowd?
No.
The market has no goal of making the crowd lose. Losing in this case is more of a side effect of other actions.
Any big player who opens a position doesn’t care who will be the counterparty to their deal – another major player or a bunch of small speculators. First of all, a major player sets a goal of generating some profit or getting a better exchange rate. It also doesn’t matter to a big player what kind of participants act as counterparties – winning or losing. A major player perceives this as the liquidity required to fully execute their trade.
Yes, there are traps, manipulation and other tricks in the market, but they are aimed at all participants. After all, no one forces you to take the bait, right?
Thus, the crowd collectively loses because it:
- has less information;
- is absolutely chaotic (has no impact force to break through a level);
- violates risk management;
- falls victim to emotions when trading.
Let's take a look at risk management, for instance. A simple mathematical equation (100% + 100% + 100% – 100% = 0) tells us that initially overestimated risks will sooner or later lead to an unavoidable loss of the deposit. And the market is not the one to blame in this case.
Bear in mind that the market never acts against you specifically. Everyone is against everyone in the market. The only thing is that you have far less opportunities. A retail trader is like a socially unprotected segment of the population among all market participants, therefore, they are most likely to sustain losses for various reasons.
Why does the market occasionally allow the crowd to make some money?
All traders who start trading market sentiment sooner or later face a situation when the market starts to move with the crowd, and not against it, thereby “allowing” it to generate profit.
But wait, who said that the market has to always move against the majority?
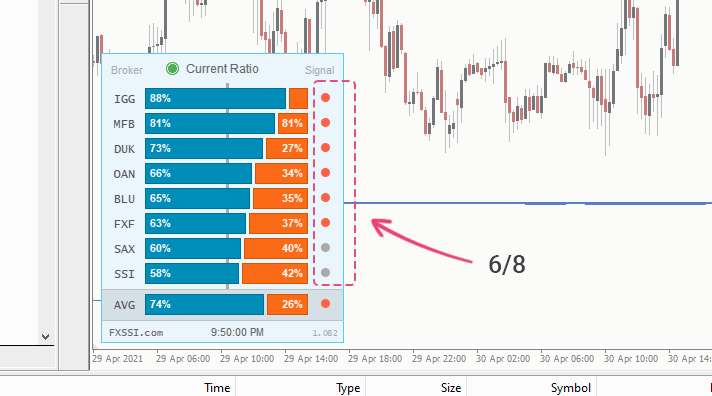
It’s important to understand that 6 “red” signals out of 8, for example, don’t necessarily indicate that the market is going to move solely downward. So, don't be mislead by a thought that the market would move only against the crowd. It wouldn't, the corrections and pullbacks can eventually take place.
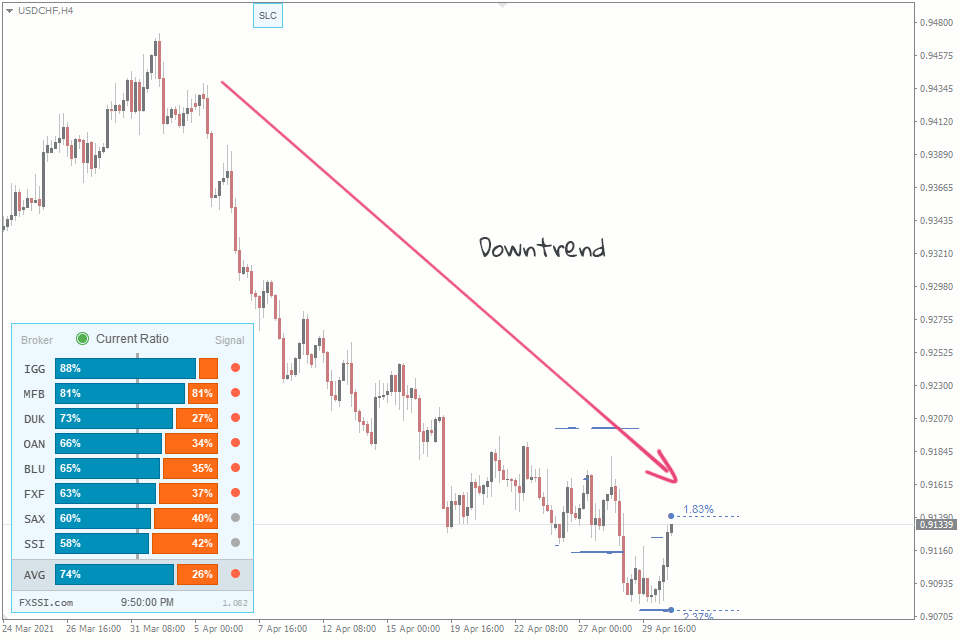
However, the long-term trend in this case will most likely be a downtrend:
There’s no need to be a maximalist. If trading was that simple, there wouldn’t be such sad statistics of unprofitable traders. You should aim at 55-60% of successful trades and that will be enough for you to consistently generate profit.
Market Analysis with SSI Indicators
Here at FXSSI we specialise in market sentiment analysis.
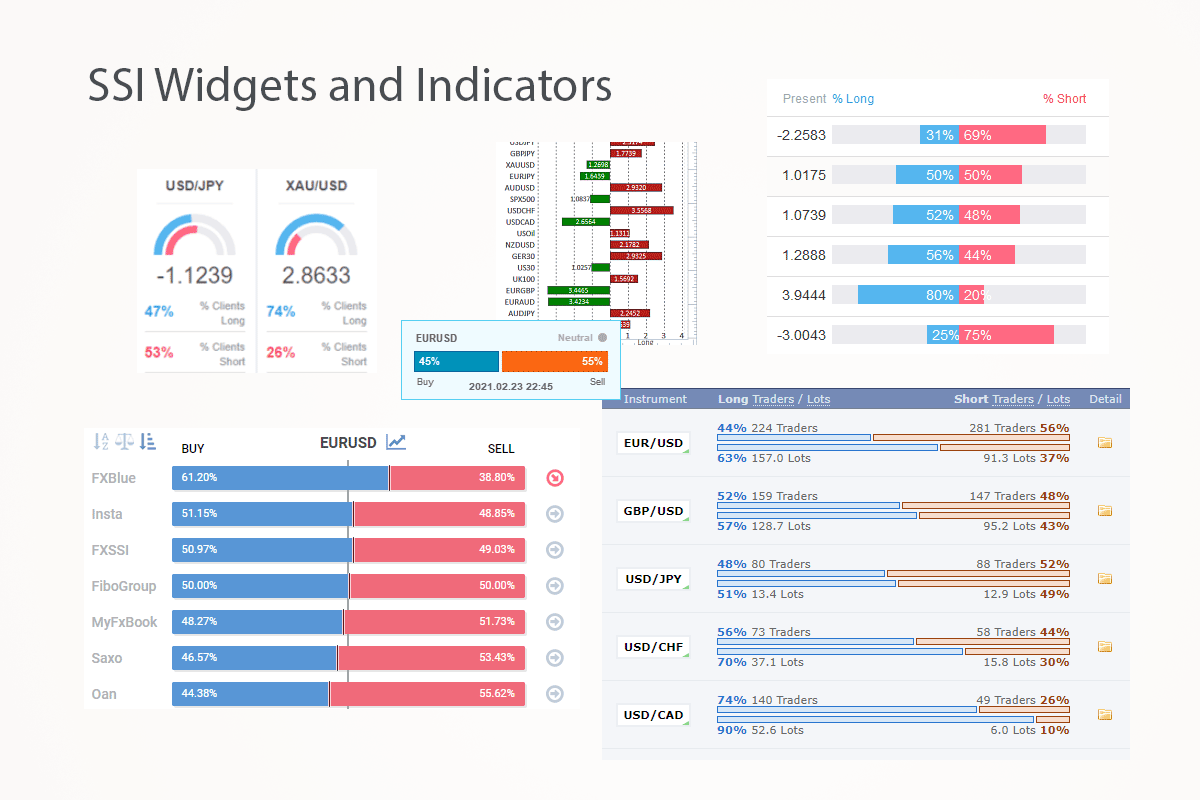
Gathering data from the largest number of sources, we have developed a set of tools for analysing SSI, making it useful for a variety of purposes.
For example, the Current Ratio tool is suitable for a quick analysis of market sentiment. It displays the positions ratio from a number of large brokers and services. It’s free, works without delays and is updated every 10 minutes.
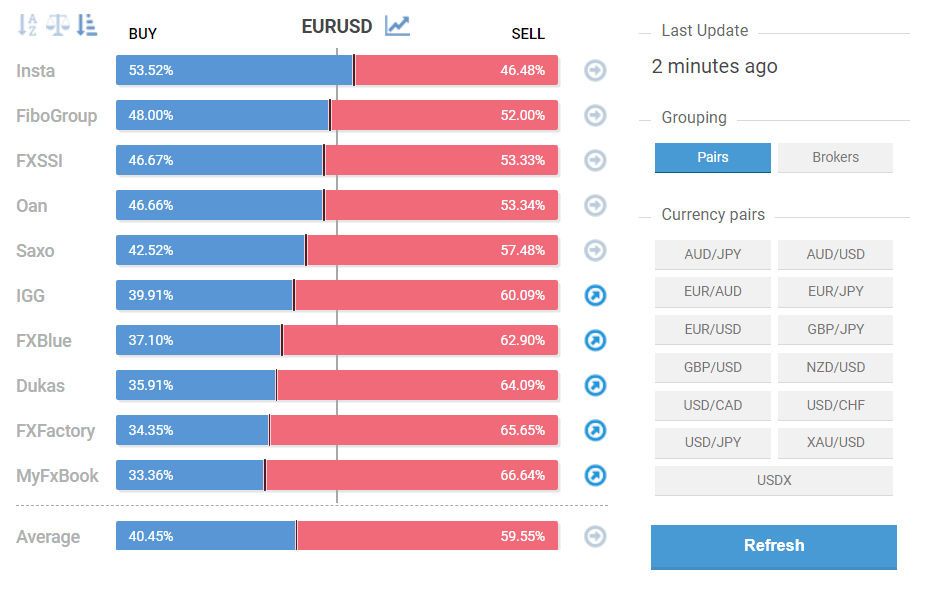
A similar tool is available for an MT4 terminal at this link.
One of the advantages of the Current Ratio indicator is that you can customize your average formula by adding or excluding some data sources.
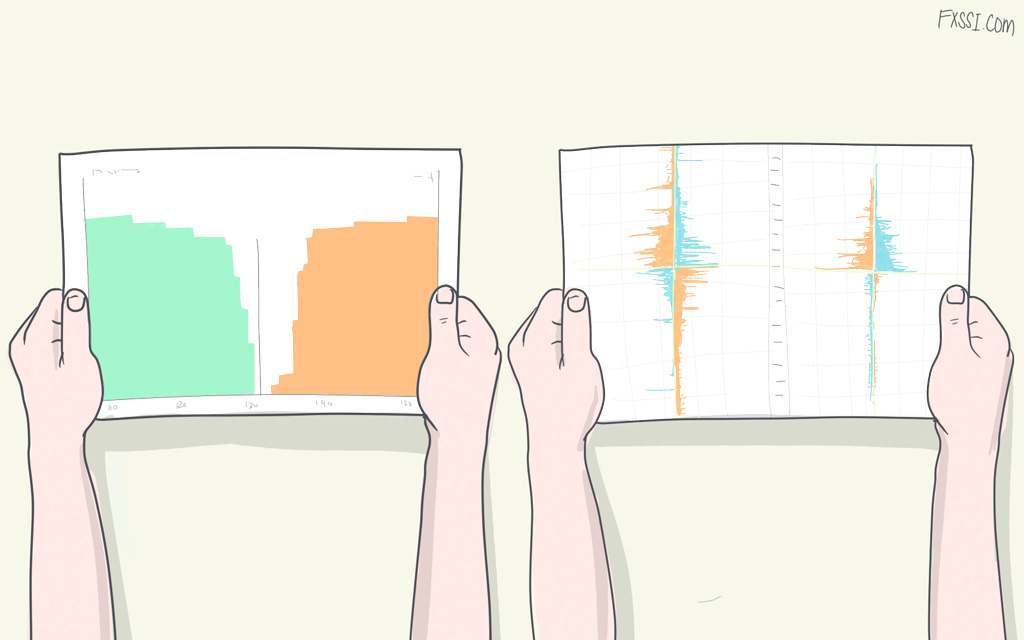
For a more detailed analysis, you can use the SSI chart.
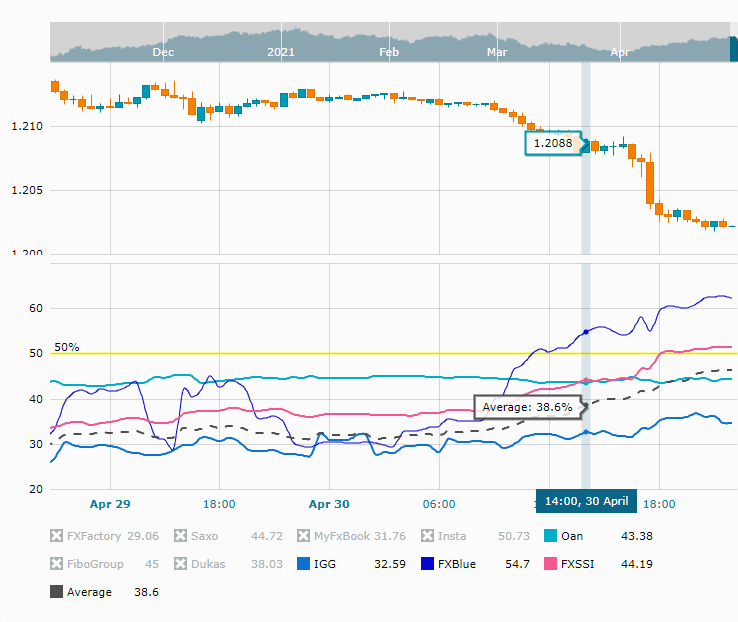
Unlike the Current Ratio indicator, the data in this case is presented in the form of a chart of open positions, which significantly improves the efficiency of the analysis.
How do you trade SSI?
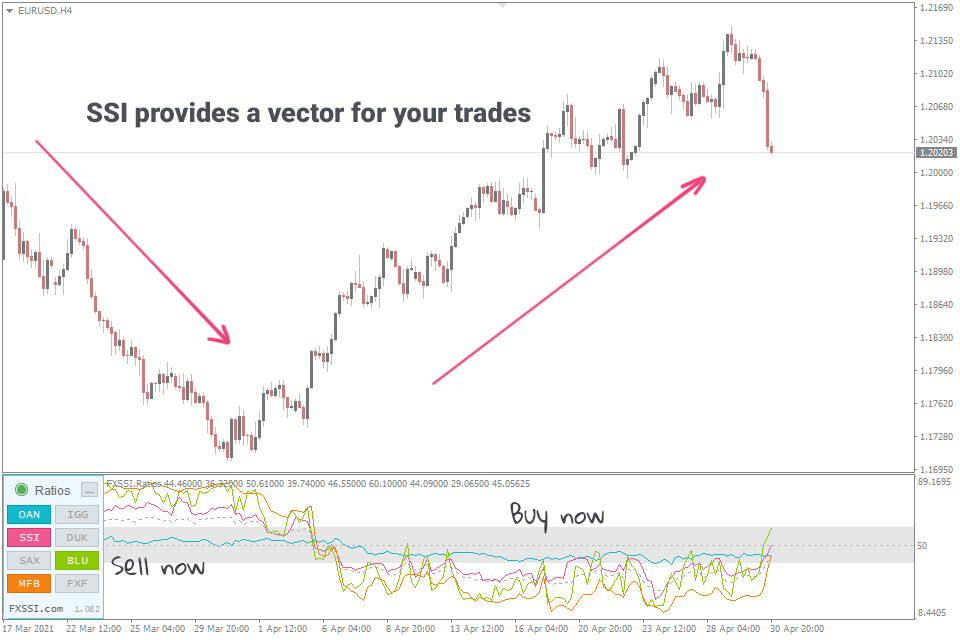
First of all, one should accept the fact that positions ratio does not give specific market entry or exit signals, except in rare cases. The ratio should be considered as a vector. Simply put, while the majority of traders are holding short positions, your long positions are more likely to succeed, no matter where or when you open them.
To determine a vector, you can compare both the current ratio and the change in the readings over a certain period.
For example, the CurrentRatio indicator can help you get a quick overview of the current market sentiment condition.
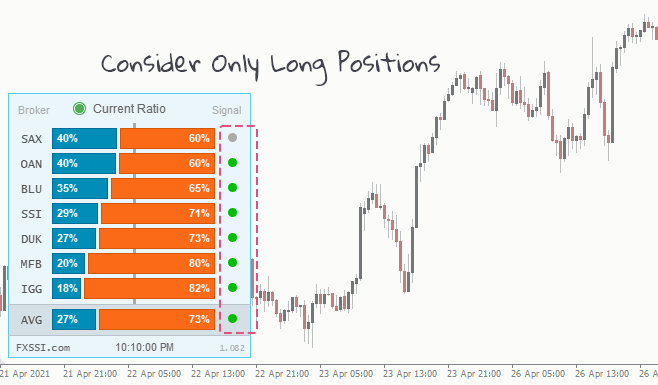
If you take a look at the image above, you might notice that it’s best to look for long positions. Opening short positions is reasonable only if there is a strong enough signal.
Overall, the idea is to find the conditions suitable for you, i.e. understand when it’s best to open trades and when it’s best not to.
This article doesn’t pursue the goal of offering you specific trading rules, since every trader has to develop their own strategy. In other words, you need to understand the tool you are using, you should adopt deliberate practice, instead of just blindly following a set of rules invented by someone else.
We’ve already published an article on 3 SSI trading strategies, however in fact, there are probably a lot more.
In Conclusion
SSI is a quite effective indicator and its use in trading is quite reasonable. That is, if we compare it with classic technical indicators. It at least shows what really is going on in the market.
Anyone who gets introduced to sentiment trading for the first time, starts with this indicator, since it’s the easiest one to understand. However, there are other tools for analysing market sentiment. For example, Order Book and derivative indicators like SLC and Profit Ratio. Some of these indicators may turn out to be even more efficient than SSI, but this doesn’t stop you from using all these indicators simultaneously.
If you are interested in digging deeper into market sentiment indicators, you can continue your journey by following our guide.