Bollinger Bands in Forex - Performance Study
Today, we'll test Bollinger Bands. They are a set of three moving averages, all of which have the same calculation period. But the standard deviation (price range) is added to or subtracted from the upper and lower ones.


Before getting started, we recommend you to read the previous studies of these indicators:
As always, we will define the objectives of the study.
Parameters and Objectives of Testing
Objective 1: Determine the effectiveness of the Bollinger Bands indicator.
Objective 2: We need to find out which approach to setting Stop Loss and Take Profit is better suited for such studies:
- Let fixed Stop Loss and Take Profit be, for example, 20 points.
- SL/TP size depends on the current market situation – for example, SL = 40% off the last candle size.
- Closing a trade when the opposite signal appears.
Strategy:
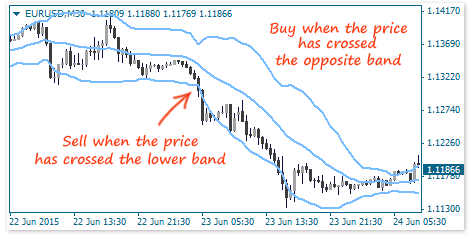
At that, we will close a trade according to one of the above-described techniques.
Bollinger Bands indicator’s parameters: period – 22, deviation – 2.
Range of the study: 2012-2015.
Currency pair: EUR/USD.
Timeframes: M1-H4.
Tests are conducted without taking into account spread and commissions. Thus, the results of the study will show the true effectiveness of the tested indicator.
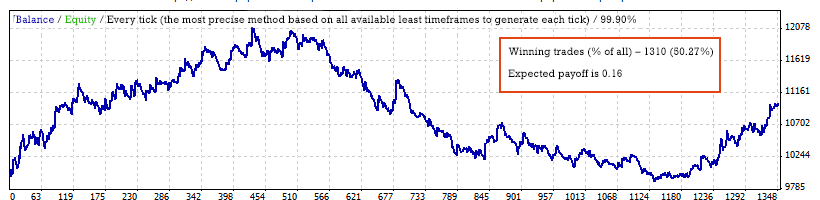
Test #1 – Closing a Trade by a Fixed SL/TP (fixed)
This approach allows identifying the effectiveness of the indicator in terms of opening a trade, but in this case we’ll miss the opportunity to reuse the indicator readings to close the same trade.
- SL = TP = 30 points.
- Timeframe: M30.
Results of the test:
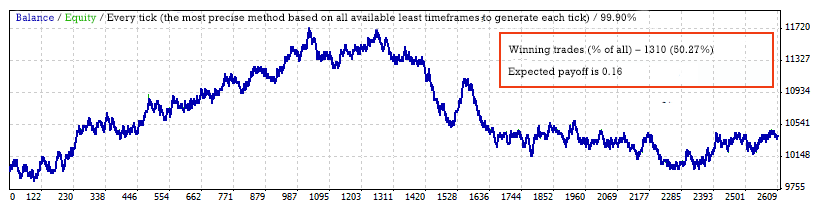
Conclusions: The above-described strategy with a fixed SL/TP generates 50.27% of winning trades, while the average profit per trade is 0.16 points.
See the results for other timeframes at the end of the article.
Test #2 – Closing a Trade by a Flexible-fixed SL/TP (flex)
Such stop orders should better take into account the market situation, but they do not use the potential of the indicator to exit a trade. Most likely, the results will be slightly better than in the first test.
- SL = Middle line of the Bollinger Band indicator (at the time of opening a trade).
- TP= Distance from the middle line to any (upper or lower) border line (at the time of opening a trade).
- Timeframe: M30.
Results of the test:

Conclusions: Indeed, a flexible stop order works better. The number of effective trades is 51.11%, and the average profit per trade is 0.44 points.
Test #3 – Closing a Trade When an Inverse Signal Appears (Reversal)
It is a classic version of closing a trade. We don't like it very much, because changing a signal to the opposite one takes a long time. Below you can see how much less trades are opened based on this method.
- Without SL/TP.
- We close a trade when an inverse signal appears.
- Timeframe: M30.
Results of the test:
Conclusions: Trades are less, the effectiveness is higher (51.21%) as well as the profit per each trade (0.75 points).
However, the result is generally almost zero as in the previous cases.
Btw, if you are looking to upgrade your terminal with pro indicators and different utilities you can browse from variety of resources available at FXSSI Product manager.
Summary Table of Results
To complete the picture, we will test all three approaches on the rest timeframes.

Goal 1. Bollinger Bands yield no results when applied in a classical way.
Goal 2. Separately for each approach:
- Reversal – in general, it showed the weakest result. Most likely, it was because the signal to close a trade is generated too late.
- Flex – it worked best of all, but it is also not suitable for a large-scale study. The fact is that one can’t come up with a flexible SL/TP for all indicators.
- Fixed – it is quite understandable for many traders; if the indicator has a profitable regularity, this approach will definitely reveal it as a whole.
What Have We Learned?

The Bollinger Bands indicator has no any profitable potential and its effectiveness is not much different from flipping a coin.
Using the fixed SL/TP is best suited for identifying profitable regularities of indicators.
Probably, you have noticed that in all three cases we ceased to make a profit from the middle of 2013. So, the indicator worked well until then, following which it stopped working.
Such situations are usually attributed to the fact that “the market has changed”. The market is always the market. Most likely, it is a matter of wandering of a random point. In addition, this failure was not so noticeable after the year of 2013 on other timeframes.