How to do Multi Time Frame Analysis in Forex Trading
There’s been a lot of buzz about multi timeframe analysis lately, but what exactly is this type of technical analysis and why should you incorporate it into your forex trading strategy?

Multi timeframe analysis is a holistic approach to technical analysis using multiple timeframes to develop a trading bias, identify a trading opportunity, execute a trade and manage that trade right through to completion.
All traders naturally look at and trade multiple time frames, but this is often done on a whim rather than with any consistent methodology. Sound multi timeframe analysis is procedural, starting with the big picture and working right down to the important details.
Multi timeframe analysis can be incorporated into any trading system or time horizon from scalping and day trading right through to long term trend following.
Traders who master trading multi time frame trading can strike the market with surgical precision, hitting big with low risk, high reward trades.
Let’s take a look at an example trade on AUDUSD from February 2021 which yielded more than 200 pips in under 48 hours.
Get the bigger picture
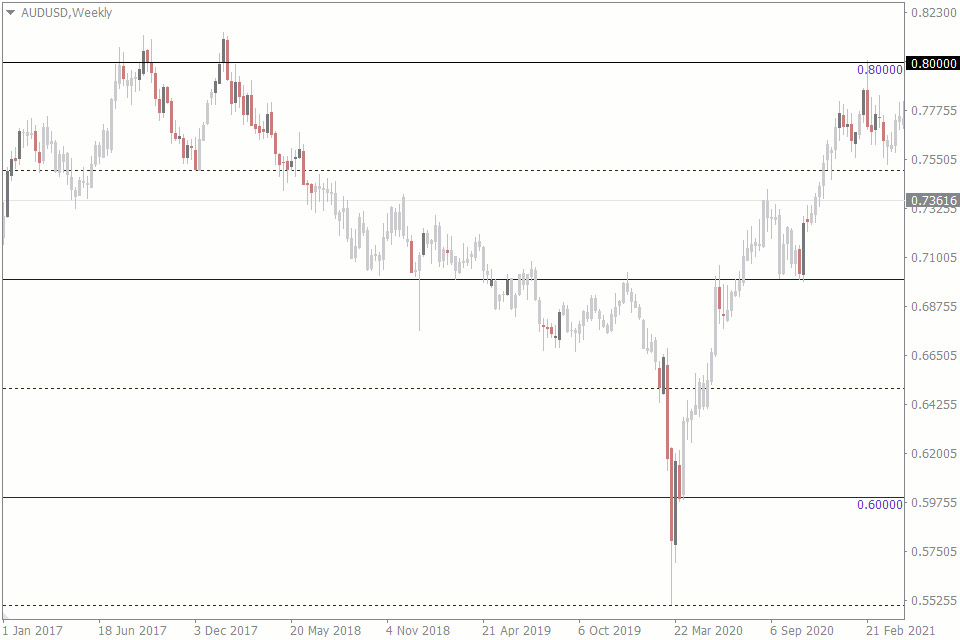
Here we have the weekly chart of the Aussie dollar from February 2021. It’s been in an impressive uptrend since the carnage of March 2020, but is approaching significant resistance in the 7940 – 8140 zone.
This zone is significant as it is home to 80c round number handle and the September ‘17 – January ‘18 swing highs which marked the beginning of a two year bear market. You can use The Round Levels indicator, which displays the so-called psychological (round) levels on the price scale of the chart.
We can’t be sure that the current bull trend will reverse entirely from this zone again, but it is highly likely there will be some kind of reaction and trading opportunity here – higher time frame levels like this nearly always yield a reaction and this is what multi time frame analysis is all about.
Now we’ve got the bigger picture and identified a potential trading opportunity on our weekly chart, let’s drill down to the daily chart to get a better lay of the land.
Note that the best time frames to trade forex and which particular time frames to use for multi time frame analysis will depend on your individual trading strategy. For example, we are using our weekly chart as the bigger picture for this swing trading example, but if you are scalping, you might use a 4 hour or hourly chart for your bird’s eye view.
Confirming what you see and planning your attack
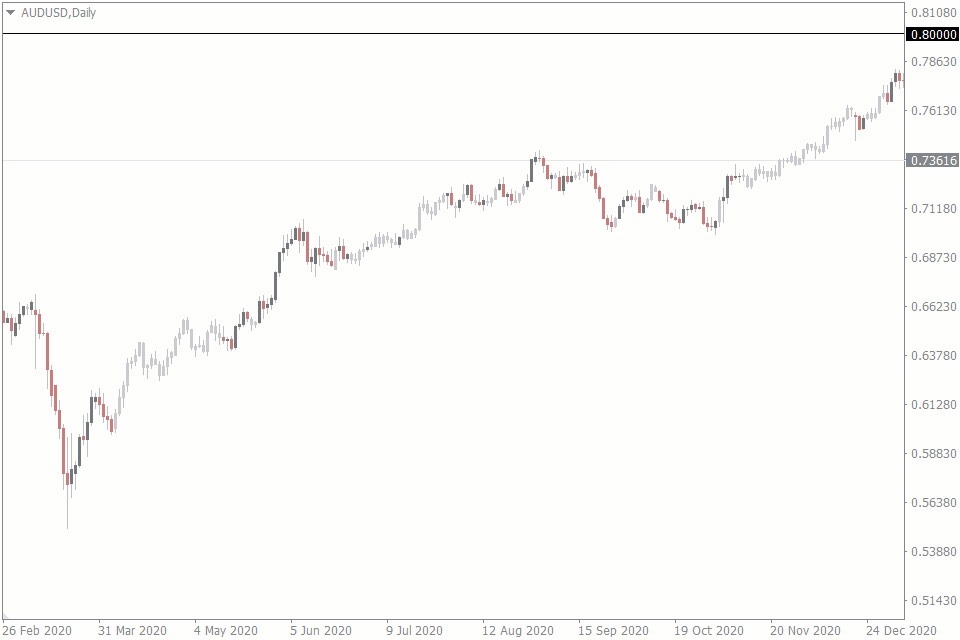
Upon drilling down we see right away just how impressive the Aussie’s recovery has been since the pandemic lows.
Our weekly zone is obviously significant and we are confident in a short position from around the 80c mark, but this is not the sort of bull trend you just short blindly with a limit order.
We’re going to have to watch for a reaction from the zone and only enter our short position if we get that reaction.
As this is a zone of weekly importance, we could wait for a signal on the daily and likely still do quite well, but we’d probably miss quite a few pips waiting for that daily confirmation.
By drilling down further to a lower time frame chart like the 4 hour, we could get a signal 4-18 hours earlier and short the market much closer to the top.
Drilling down further and executing
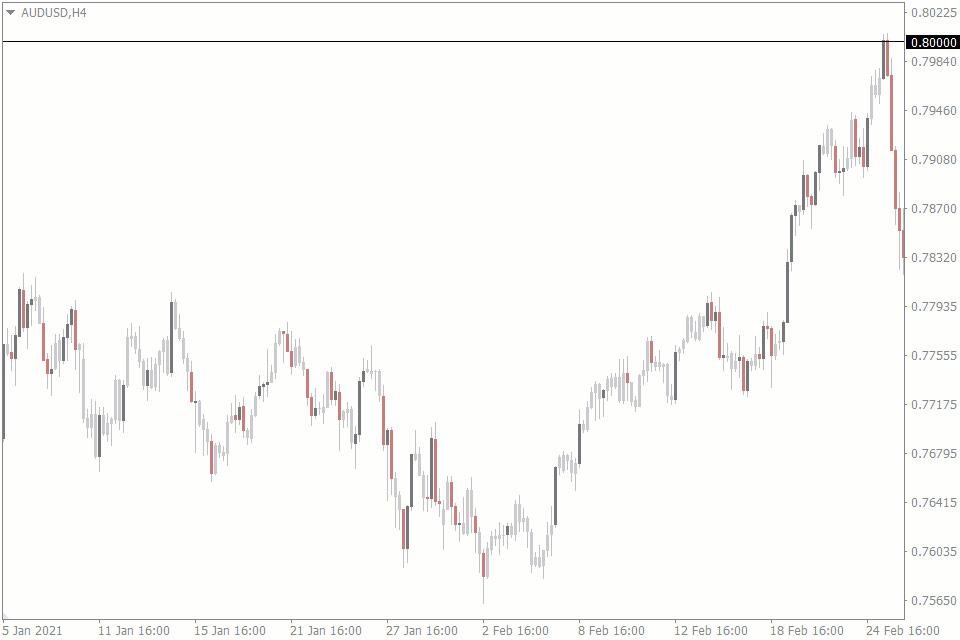
We watch the market patiently over the coming days and start paying very close attention once the Aussie enters our weekly zone and approaches the 80 cent mark.
Our patience is soon rewarded with a false break at the 80c level marked by a Dark Cloud Cover reversal candle.
We execute our short position and drill down to an hourly chart where we’ll let an average trail us out.
Using lower time frames to manage your trades
After stalking the market for days we don’t want to be too greedy and let our prey get away from us, but we don’t want to take profits too soon either.
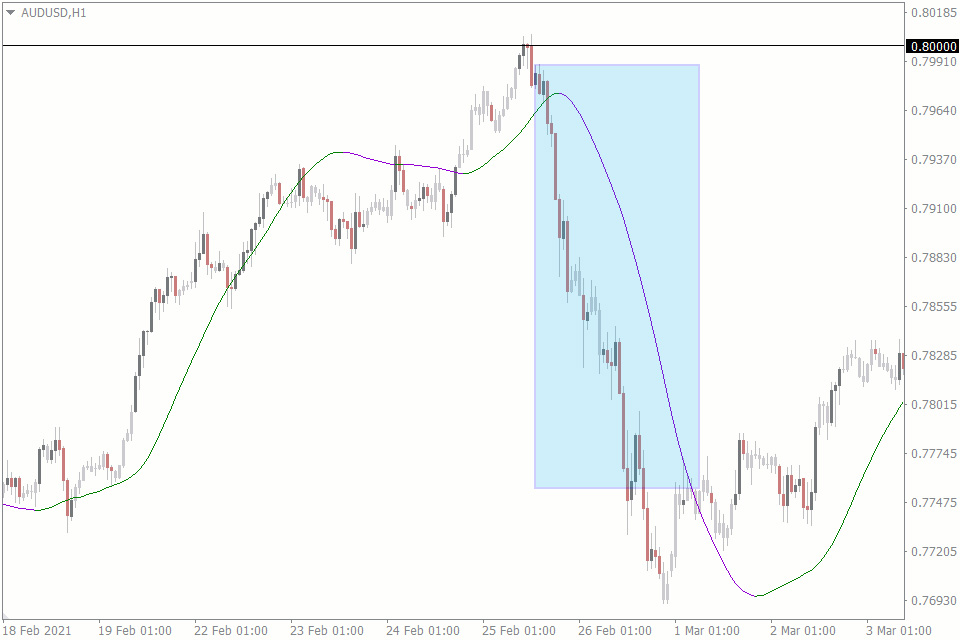
By allowing an hourly moving average to take us out of the trade, the position will be allowed to run as long as it is moving in our favor, but we won’t give too many pips back waiting on a higher time frame exit signal.
We walk away from the trade with a solid 230 pips and return to our weekly chart to hunt for the next opportunity.
Automating multi time frame analysis with forex indicators
As you can see, multiple time frame analysis can be an incredibly powerful method for capturing low risk, high reward trades, but If you’re analysing multiple symbols across multiple time frames, that’s a lot of levels, boxes and lines to draw and keep track of.
Automated analysis indicators like Auto Trend Lines and Auto Trend Channels make multi time frame analysis a breeze as they automatically plot important lines on your charts and even mark which time frame a particular line or channel is derived from.
These indicators for MT4 take a lot of the subjectivity out of technical and multi time frame analysis, ensuring you use a consistent and unbiased methodology across every market and every time frame.