Market Makers - Their Point of View on the Market
In this article, we would like to discuss the problem of “secrecy” of the Forex market and help some traders understand certain things they don't seem to grasp.


How does the Forex market differ from other stock exchanges, for example, the New York Stock Exchange (NYSE)?
The difference is that the latter has a certain central server where all orders are processed and the process of pricing itself takes place.
Traders have access to such exchange information as the number and volumes of trades and also data on all pending orders. In other words, everything that happens on the stock market is displayed in the terminal of a trader.
Forex, on the other hand, is a decentralised market, which means that any exchange information is simply missing. Therefore, most traders conduct trades basically blindfolded, relying only on indicative prices.
You cannot but agree that there is a difference – analysing only with the help of the technical analysis or using it alongside trading volumes, order book, delta, market profile, and other exchange tools. By the way, perhaps this is the reason why the percentage of profitable traders in the equity market is larger than in the Forex market.
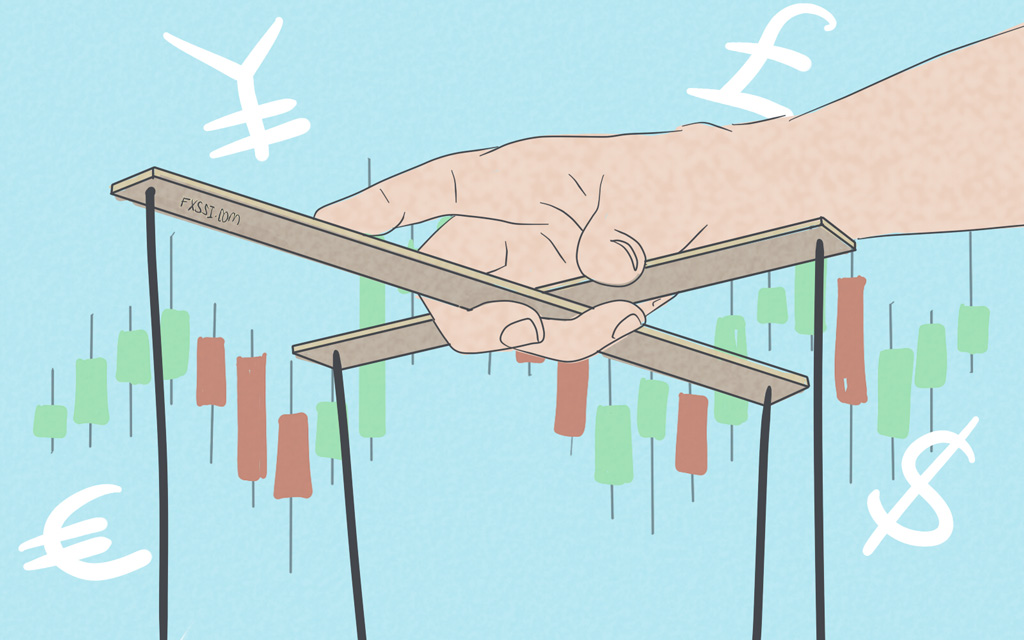
Here's a vivid example: Forex can be compared with a puppet theatre, where you enjoy a beautiful show program on stage, but everything that happens behind the scenes is hidden from your eyes. We don't know what's going to happen next and who's operating the dolls (who are the market makers in Forex). Perhaps, it’s a friendly gentleman, or maybe it’s a sinister character.
Who is a Market Maker?
Simply put, a market maker is a market participant, who has influence on pricing. As we understand it, a market maker is any market participant, who is able to influence the price of a certain financial instrument.
Just to be clear, it's not about some mythical man who trades out of spite, it's about specific players in the Forex market: banks, funds, and large private investors.
In addition to the ability to influence the price, a market maker has other benefits as well. As far as we know, market makers do have some information about the location of Limit and Stop orders of smaller market participants (it’s about us). With large banks, we can assume that they analyse an aggregate trading activity of their customers and possibly pass these data to other banks, but we can never know for sure.
It may seem that market maker is almighty, but the fact is that most of them cannot simply reverse the price at any time; besides, there are other market makers who can prevent them from doing this.
What Do Traders See, and How Do Market Makers See It?
Let's take a look at an ordinary trader and analyse what he/she sees (uses) in their own chart every day. So, first things first:
1. Indicators represent some formula that uses “past” data and supposedly predicts something, but, unfortunately, it does not predict anything.
2. Lines, channels, supports, etc. In this case, they are effective to a certain degree, but it is impossible to determine exactly whether there is any support at any particular level.
3. Patterns, formations, and waves. Once again, one cannot know in advance whether the price is going to interact with this pattern. However, most traders do see simple patterns, so a certain level of interaction of the price with them can be still noticeable.
The list goes on, but we'll stop here. Taking into account all of the above, we can conclude that traders analyse the market horizontally. This means that we take some historical data (a chart), look for regularities, draw lines, but with all that, we still don’t know what is actually happening there and why the price hasn't reacted to our indicator.
Market makers, in turn, don’t really care what MACD shows us or that the “Butterfly” pattern is complete and a possible trading scenario is starting to play out. Moreover, they don’t even look at the chart and don’t need volumes, since all of that is the “past” information.
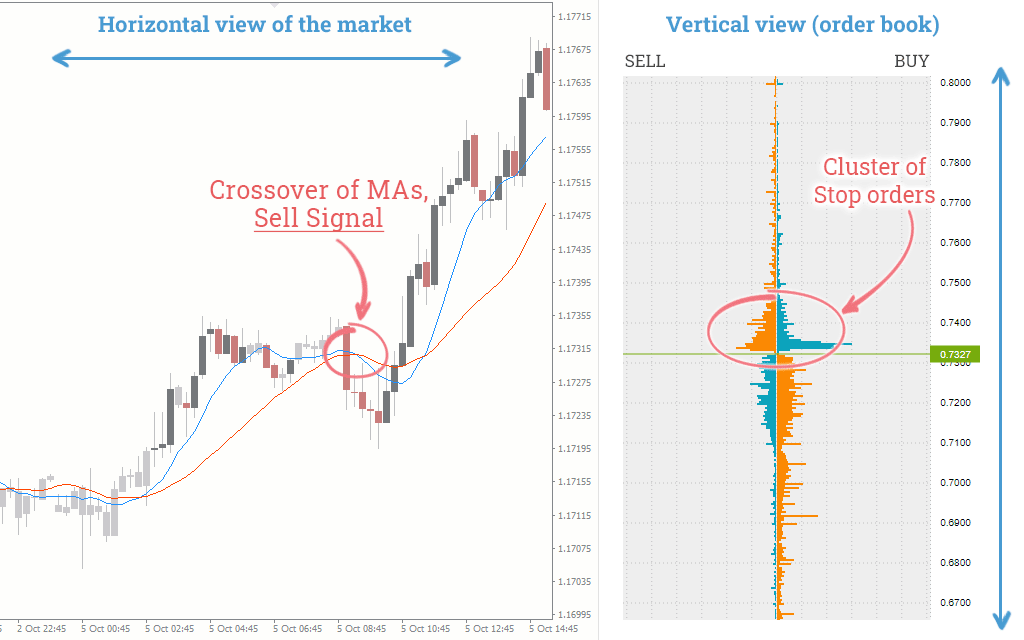
Market makers analyse the market vertically. They have a so-called order book (just like the one in the picture below), where all our Take Profits, Stop Losses and pending orders are displayed. They simply don’t need any other information as they can influence the price movement.
Here is a vivid example of how the vertical view differs from the horizontal one:
While the Moving Average indicator signals Short, see the chart on the left, the cluster of Stop orders above the current price is clearly visible in the order book on the right. Market maker is interested in such clusters, and, as we can see, the price responds accordingly.
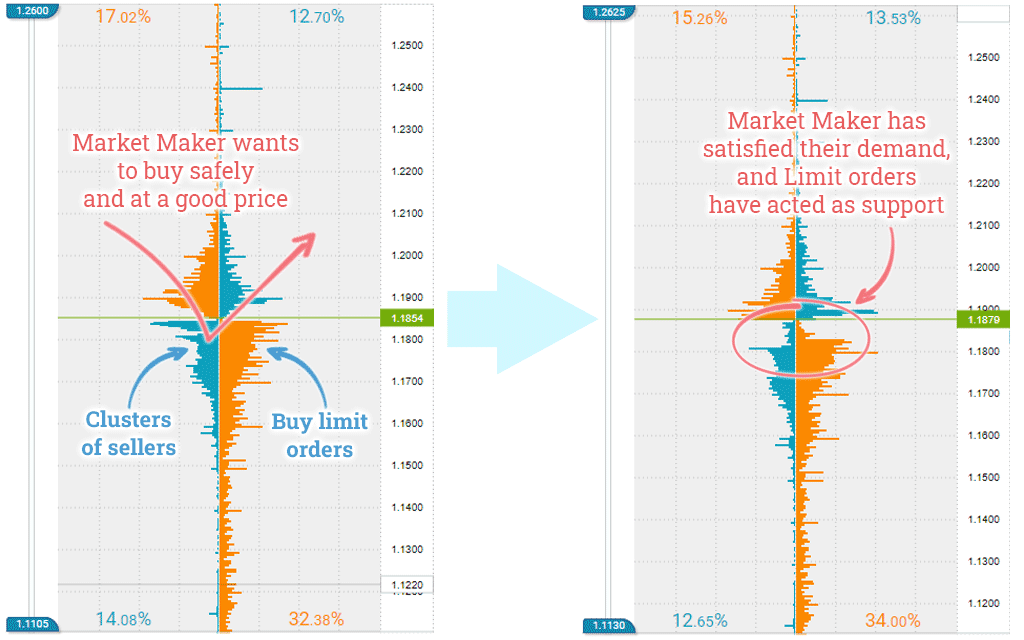
As we've mentioned before, market maker can't simply reverse the price. However, they can push it to the required level, move it towards the cluster of Stop Losses, or help form a pattern and "launch" it, if this is their goal, of course. In other words, a market maker acts against the market crowd, but on the other hand, they need another part of the crowd to push the price in the right direction. Here's a picture to illustrate this:
Let’s take a closer look. Let's assume that a market maker wants to buy a currency and, of course, they want to do this at the best possible price. The left side of the picture above shows a pretty good cluster of Sell orders, which are our Stop Losses in this case as well. This volume of Sell orders will be sufficient to satisfy the demand of a market maker. On the other hand, we can see a cluster of buyers – they will be used as a safety cushion to prevent the price from breaking out further. All that is left for the market maker to do is to push the price towards the cluster by placing small orders, gather all sellers in one place, and Limit orders are going to act as a support restraining any further price movement.
By the way, we use pictures showing the Order Book in our examples, but this is not exactly the order book that market makers have. However, this is a small part that is available to ordinary traders and is well-suited for the examples provided in this article. If you are unfamiliar with the concept of the order book, read this article "How to Trade Order Book".
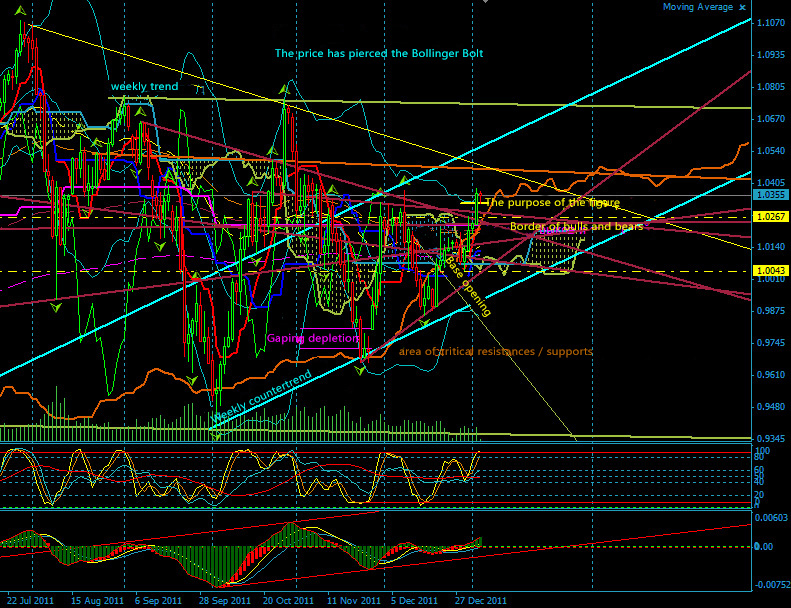
Let us digress for a bit: once we've posted these pictures on a major online forum (intended for newbie traders) which is also known for its specialisation in “Ilans” and other Expert Advisors destroying deposits and pretending to be profitable trading robots. So, all we got in response to our request to share knowledge was a phrase:
“It doesn’t make sense to understand what the middle line is and what it displays. It's easier to say that “crossovers don't work”. You just need to think a little and recall the high school math course.”
Of course, it made us smile, but the problem is that there are lots of such “experts” on a large trading forum and a huge number of self-proclaimed traders continue to hide prices under the “layer of indicators”.
It's obvious to us. What about you?
The first obvious thing: there is no use fighting with market makers – after all, there's a reason they are called “smart money”, and ordinary traders are called “housewives”. They know better than we do how the price will behave and how to make money (why wouldn't they if they are the ones pushing the price).
Unfortunately, we don’t have the necessary tools to track market maker's activity, so all we can do is try to imitate their behaviour in the market.
What do we need for it? We need to act against the market crowd since this is their (market makers') primary strategy, otherwise they would simply not make any money.
The second obvious thing: you should finally realise that indicators are a dead-end. The market and market makers in particular don’t take them into account, and we have already explained this in our other articles: Moving Average Indicator Crash Test, Indicators Study: RSI vs CCI vs Williams %R, Bollinger Bands: Testing. The only useful indicators are informative ones, for example, round-levels, trading sessions or news indicator.
So, what to use for the analysis then? Any available exchange information on Forex (volume, ratios, and order book), important price levels, patterns, and trends.
The third obvious thing: Forex doesn’t tolerate negligence – you have to understand what you’re doing and why. Professional trading is a conscious systematic approach, and not a set of rules.
Simply put, if you’re using an indicator, you should know its formula and understand its readings, don’t go on saying: “RSI has exceeded 70 – I’m going to sell!” We recommend reading this article "Deliberate Practice vs. Set of Rules" on the given subject.
We hope you have enjoyed reading this article and have been able to learn something new from it.


