Order Book. Part 1. – Description of the Tool
The guide composing of five parts is intended to help beginners in mastering the Order Book and its derivatives faster.

- Order Book. Part 1. – Description of the Tool
- Order Book. Part 2. – Basic Signals
- Order Book. Part 3. – Ins and Outs
- Order Book. Part 4. – DOMs Signals
- Order Book. Part 5. – Examples of Complex Analysis
Here you can find answers to frequently asked questions and examples of practical usage.
What makes the Order Book data interesting?
Order Book data comes from a large brokers clients base.
The broker’s clients base is created in such a way that it is a representative sample used to assess the entire Forex market. Imagine that certain broker is 1% of all traders in the market. If one quarter of them wants to buy Euro, it is highly probable that the quarter of the rest 99% of trader will buy the Euro.
Let’s consider a more simple example than that provided above: we are going to compare the clients sentiment with the results of exit polls. As you know, the exit polls are always conducted simultaneously with elections, and their results are always close to each other. Now, imagine that the Order Book data are the exit poll’s results, and the Forex market is the elections.
Understanding of the fact entitles us to use the Order Book as a source of trading signals.
What is the Order Book in Forex?
First, this is the analog of a stock order book, but created for the Forex market only.
In Order Book you can see the positions opened by traders at the given moment and the levels at which these traders set their Stop orders.
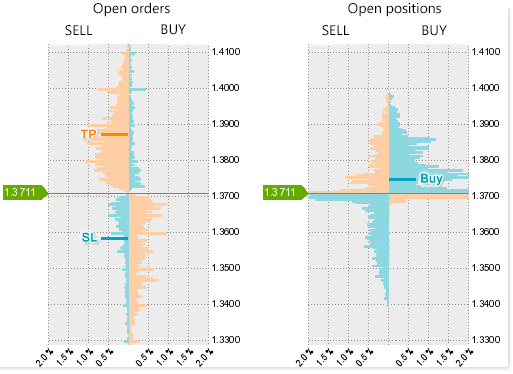
There are two order books which look as follows:
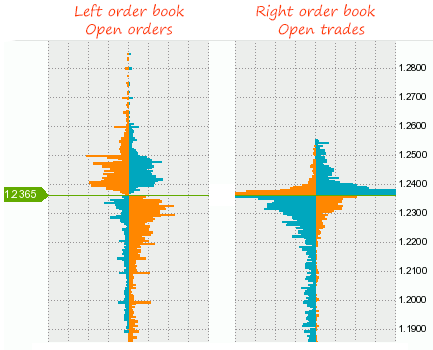
All the pending orders including Stop orders are displayed in the left order book, so it’s also called Open orders.
Sell orders are on the left side and Buy orders are on the right side.
Below are the names of the orders displayed in the order book:
- Stop Loss, Take Profit;
- Buy Limit, Sell Limit;
- Buy Stop, Sell Stop.
The orders are arranged in such a manner:
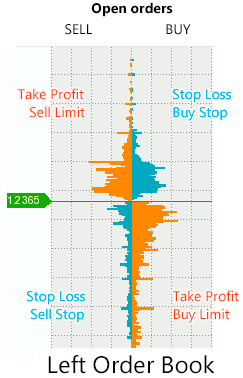
If we divide them by their color, Limit orders and Take Profit orders are orange, and Stop Loss orders and Stop orders are blue.
If you do not know what is the difference between a limit order and a stop order is – you can read this article.
We must remember that the blue orders accelerate movement and the orange orders slow it down. We'll talk about it later.
The orders currently opened by traders are displayed in the right order book. They are the orders opened earlier but not closed by now.
Sell trades are on the left side and Buy trades are on the right side.
The structure of the right order book:
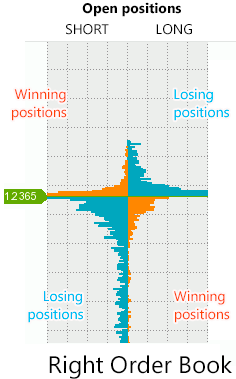
Losing positions are blue-colored and winning positions are orange-colored in this right order book. It is important – bear that in mind.
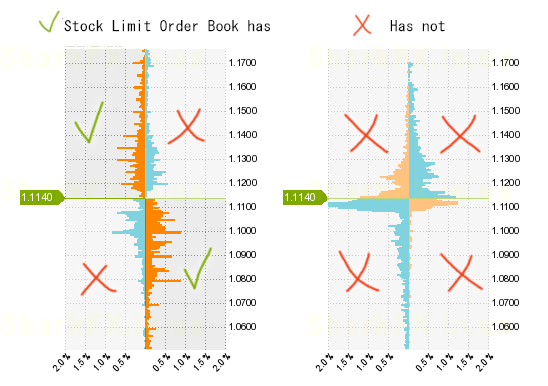
Now check out how super cool is the Order Book as compared to an ordinary stock order book. Picture.
We have learned what’s the difference between the left and right order book. The left order book will be hereinafter referred to as open orders, the right order book as open positions and both these order books as an order book.
How Is the Order Book Formed?
A new "snapshot" of the order book is formed every 20 minutes and (Your attention please!) made publicly available at xx:02, xx:22, and xx:42 o’clock every hour. It follows that when a new hourly candlestick occurs and the first order book concerning it will be formed in 2 minutes only.
We’re often asked what is displayed in the order book – the volumes or the number of trades. Our answer is the volumes but in the form of percents.
The Procedure For the Order Book Formation:
- The total volume of trades for a currency pair is determined separately for orders and positions;
- Trades are distributed among round price levels, for example: trades made at the levels of 1.1250, 1.1251, and 1.1249 are displayed at the level of 1.1250 in the Order Book;
- The sum of trades placed at each of these levels are determined as a percentage of total trading volume.
As a result, data are displayed as follows: Price level – percentage of volume. If we arrange these levels in order, we obtain the order book.
A column of the trading volume histogram displayed in the order book usually equals from 0 to 2%. This is why you can see a grid with an increment of 0.5% in the picture below.
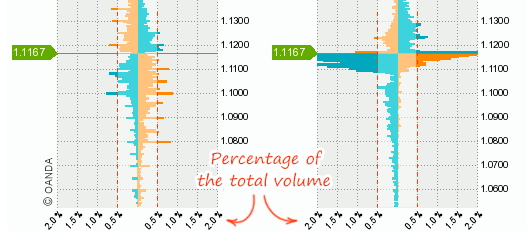
The grid of volumes can help us identify important levels. For example, the levels with the volumes of more than 0.5% can be regarded as important. The zone where the volume > 0.5% is highlighted on the picture above.
However, you mustn’t filter out the levels where the volume < 0.5% thoughtlessly since they can be helpful for you.
Margin Trading and The Order Book
The margin trading implies opening two trades instead of one: first, you buy and then sell to close this trade.
This is why there is a link formed between the left and the right order books. For example: if a batch of stop-losses is triggered in the left order book, a part of trades disappears from the right order book. Truly speaking, for now it is hard to say what particular trades have disappeared.
It would be nice if you realize by yourself how the link between these order books is formed. We have published these pictures before, but it’s ok if we do it again.
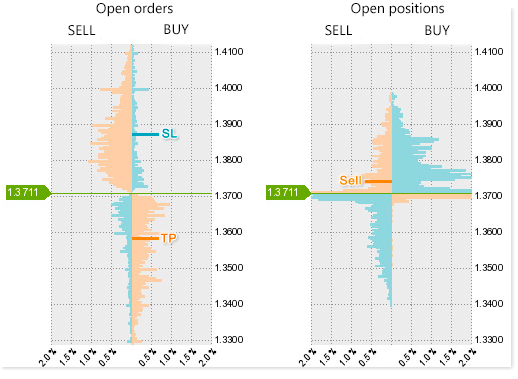
How will your trades be displayed in the Order book?
- Assuming that you have very recently opened a Buy trade (it’s losing for now) and set Stop orders for it:
- You open a second trade – a Sell trade (now it is profitable) – and set Stop orders for it:
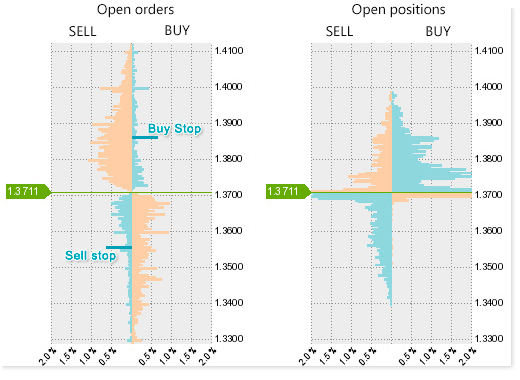
- You suppose that price is moving within a channel which has a width of 300 points. You set a Buy Stop order and a Sell Stop order at its boundaries in the hope of its breakout:
What kind of conclusions you must from it?:
- If stop-losses in "Sell" section (see the left order book) have been triggered, it indicates that buyers have been squeezed out of the market. On the contrary, if stop-losses in "Buy" section have been triggered, it indicates that sellers left the market;
- One open trade might have two volumes of pending orders or one volume, if only a stop-loss is set. If a stop-loss is not set, it has 0 volumes. All of it adds a little margin of error to the link between these order books;
- If Limit orders and Stop orders are present in the order book, it doesn’t guarantee that they will be executed upon price hitting their levels – the orders can be moved or canceled. The assumption that there may be some manipulations in the order book seems logical. For example, the order book with Limit orders is much robotized in the stock markets, so its efficiency decreased. Fortunately, the Forex order book doesn’t suffer from this disadvantage, but we repeat once again that manipulations are possible there.
- New open trades appear in the order book only if the price moved through this levels. Open trades cannot appear somewhere below or above the price spontaneously.
Order Book Dynamics
Analysis of the order book’s formation dynamics is an essential part of its analysis.
Move the mouse cursor over the chart in DOM snapshots tool. You can notice in the left order book that volumes rise at particular levels, decrease at other ones and remain the same at some levels. One can conclude from it that if trades rapidly appear at some level it follows that the level is of interest and price will interact with it.
In the right order book, we can see that Buy trades are closed faster than Sell trades at certain levels and vice versa.
We can retrieve very valuable information from the price which has gone up/down first and then returned to its starting point. If we compare the order books displaying similar price but after some manipulations, it often becomes clear what was the point of these manipulations.
Net Value and Zooming
Net value is the difference between selling price and buying price. More details in the picture below:
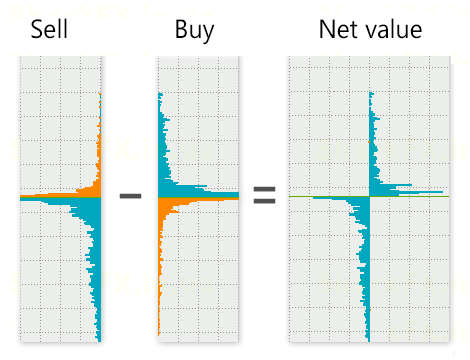
The "net value" facilitates identification of the levels where either buyers or sellers dominate.
Many people think that the equation of buyers and sellers (the net value approaches zero) neutralizes price level following which the level is no longer interesting. We cannot fully agree with the statement but there is some truth in it.
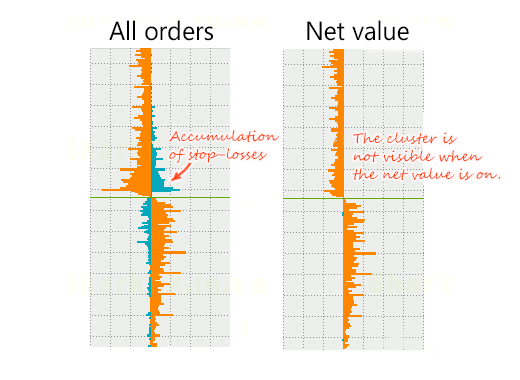
If the net value is enabled in the left order book, you can clearly see "spikes" with stop-losses. However, the "spikes" are equally well visible while the net value is disabled. There are situations where the net value hurts, for example:
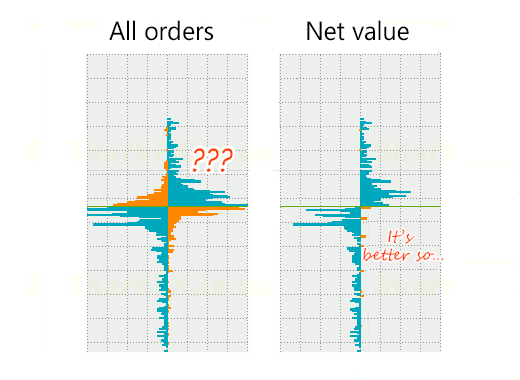
The net value performs better in the right order book (open trades). The right order book always looks like "packed with trades" close to price and it makes it harder to figure out who dominates at the levels – sellers or buyers. The net value helps to clarify it very well. See for yourself:
You can enlarge the order book by pressing the "Zoom in" button.
As a result, the range of the prices covered will be narrowed approximately by two times and the prices will be displayed in more detail.
Zooming is good at more precise identification of the accumulation levels. It’s easier for some people to find out these levels without the use of the zooming – it’s probably due to the effect of habit or volumes visually shrinking while zooming in. Our eyes like deceiving us…
The next part of the manual.


