Order Book. Part 5. – Examples of Complex Analysis
We are pleased to present you the last part of our guide "mastering the Order Book", where you’ll find some examples of the order book analysis.

Here you can read the previous part of the guide.
We would like to focus your attention on the complexity of the order book analysis: first, several (but not one) signals by the order book will be used, and, second, technical analysis of the market will be also taken into account.
The examples in this article were taken from the forecasts section of our site and were real forecasts, and not just the selection of a nice pictures in the history.
Let’s start.
Example 1. Short-Term Forecast
This is the chart we have seen after opening a trading terminal:
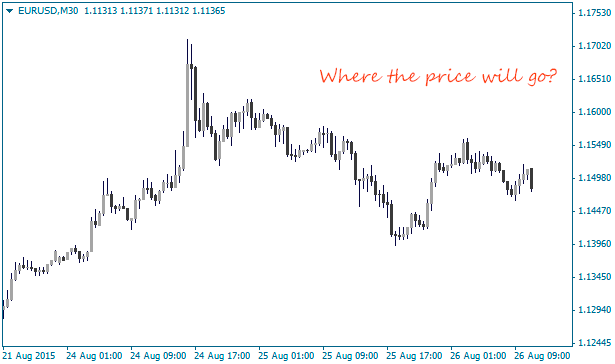
It’s hard for everybody to say where the price is going to move, so let’s analyze the given chart in more details.
First, let’s plot some technical levels on the chart to use them as a starting point for our analysis.
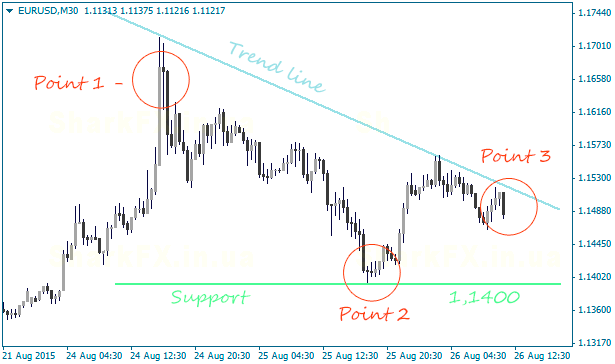
No, it’s not a triangle pattern. The lower line acts as a support level formed below the local low and the upper line stands for a downward trend line.
We marked three key points for the analysis on the chart:
Point 1. Here we can see a powerful upward spike followed by a further 100% retracement (i.e. the price comes back to the level prior to the spike). Technical analysts call it a "doji pattern".
The technical market picture signals a possible downward move. However, does the order book confirm the signal?
The order book as of before and after the impulse:
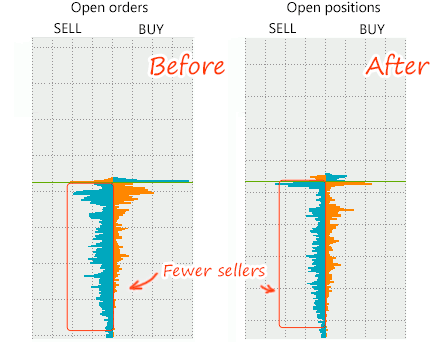
Have you noticed how much "skinnier" the order book became during this spike? It may be seen as an ultimate surrender of sellers and a green light for the downward move. We can see that the price has dropped to the Point 2 – it indicates a mid-term downtrend. Next, we are going to look for the buying opportunities.
Point 2. We can see a reversal at this point. Let’s look at the order book:
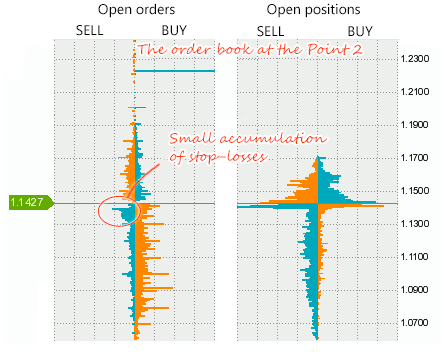
It’s impossible to tell the specific reason for the reversal from the picture displayed in the order book, but the price has probably been pushed backward by winning sellers. We can also see that the price has gone upward and left a small accumulation of stop-losses.
These stop-losses cannot serve as a projected target, but they can benefit in the future…
We have noticed that these "forgotten" accumulations of stop-losses act as an effective base for new accumulations. In other words, if price approaches the level again, we can expect a new and already full accumulation of stop-losses to appear in this place. If this is the case, we’ll be able to use it as a projected target.
What good will it do to us? It allows us to forecast accumulation of Stop orders at this level while price is far away from the level. Learn more in this picture:
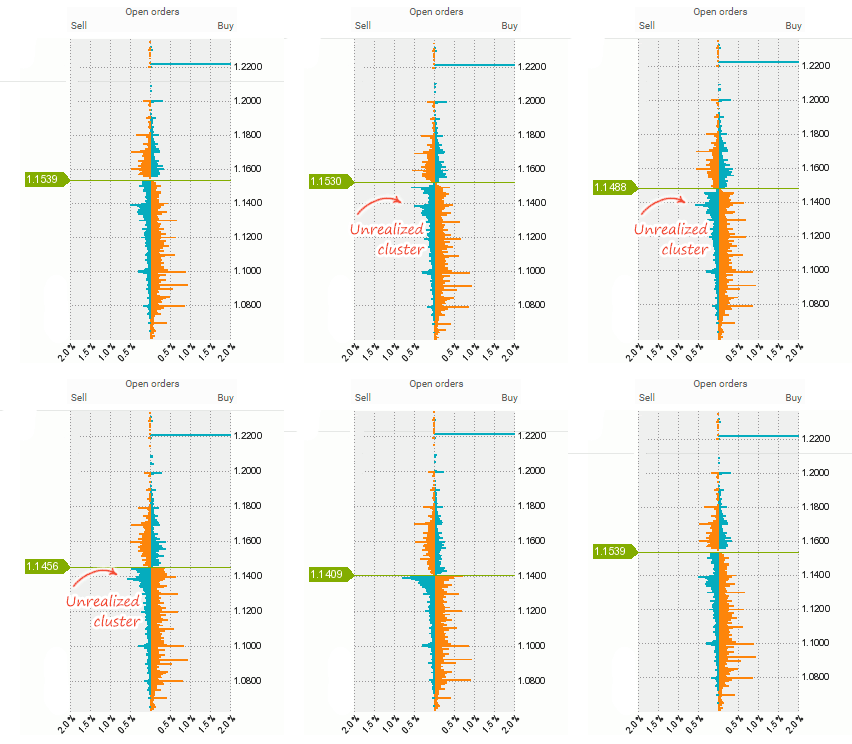
In simple words, if the price hits 1.1410, it will necessarily move below up to 1.1390. We remind you that you mustn’t "aim" at (i.e. use as a projected target) these small accumulations of stop-losses until a downward signal appears.
You must understand that these accumulations might enlarge and become full when price approaches them, but it’s not the fact that the price moves closer to them.
Point 3. The last available picture just before making a trading decision:
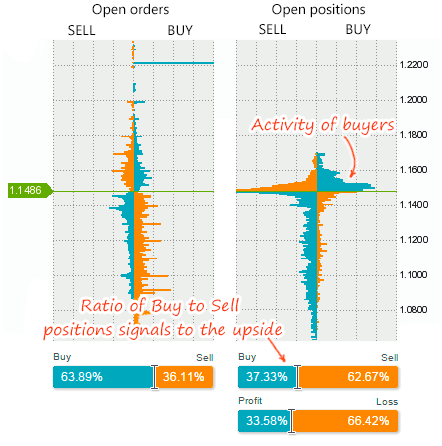
The ratio of Buy to Sell positions signals to the upside, but can we trust it in this situation? The answer is "no". The point is that we can see the activity of buyers above the price – it caps a further upward move. If the number of buyers above the price would be at least 20% more, we will more likely not regard it as a signal. A similar situation was described in the fourth part of this guide.
As a whole, it may be regarded as a short-term bearish signal.
Besides, the price is close to the downward trend line which itself is a nice entry point – the price may test the line or bounce off it.
So, what do we have at this point?
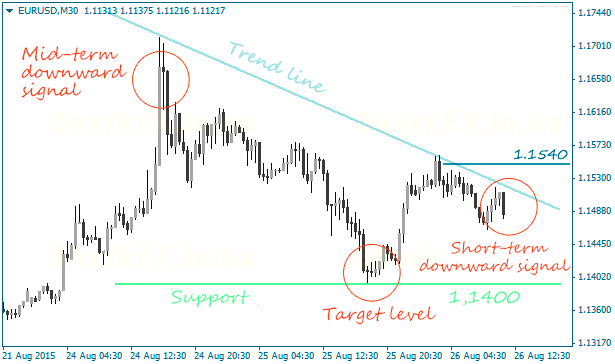
Short-term and mid-term downward signals plus the trend line which is close to the current price now. We may consider opening a short position, but are there the levels at which we can set Stop orders?
Stop-loss. As it has been described in one of the parts of this guide, stop-loss may be set beyond a losing accumulation of stop-losses. Therefore, if it is triggered by price, the price will keep moving but not reverses against you.
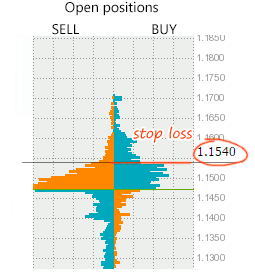
And lo and behold, the stop-loss level has "randomly" coincided with the one set according to the stop-loss setting rules described in this method – it is also beyond the downward trend line… You couldn’t do better.
Take-profit. In this case, we need "forgotten" stop-losses. We expect a price to go lower since we’re planning to sell. If the price does begin to go lower, the "forgotten" accumulation will start to enlarge and most probably turn into a true one which was described in the article about basic signals. Therefore, it allows us to make use of this accumulation as a target level.
Now let’s compare it with the forecast we told you in the beginning of the article (orange color stands for forecast and blue color stands for real-time chart).
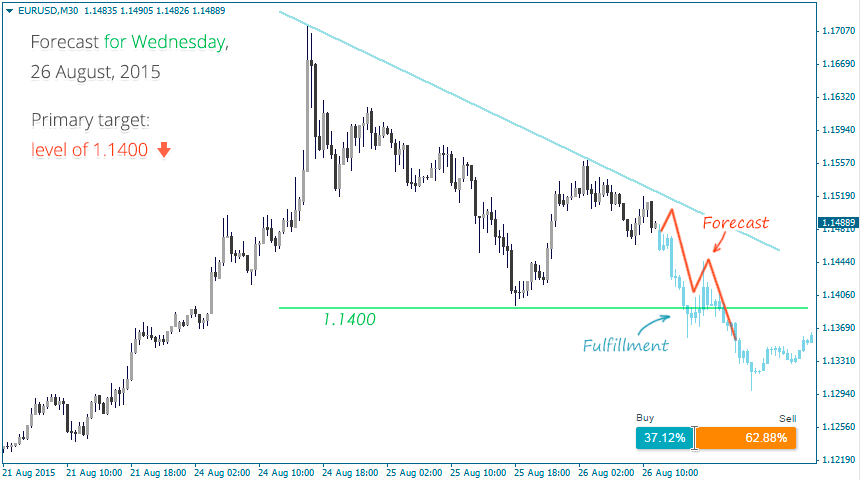
As you can see, the complex analysis helped us to understand the current market situation better and make a correct forecast.
Example 2 – Forecast for Week
The second situation represents a weekly forecast for EURUSD. Below you can see a picture where we have made technical analysis:
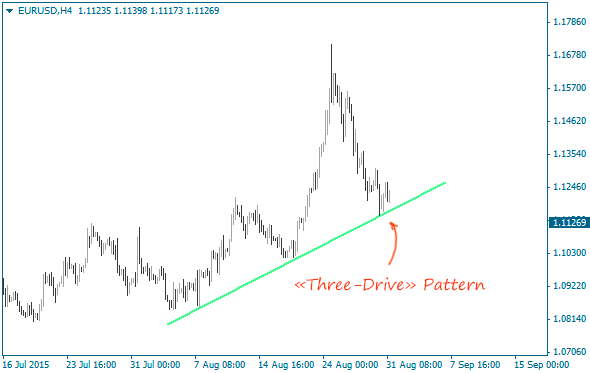
There is a "Three-Drive" pattern indicating a possible bounce to the upside in the picture. However, let’s look at the point of 3rd drive displayed in the order book:
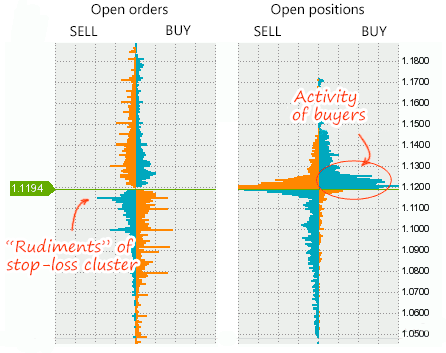
Below we can see an accumulation of stop-losses that doesn’t yet meet all the requirements of the right (i.e. full) accumulation so we just keep it in mind.
There is an activity of buyers above the price – the activity is minor but it is larger than that of sellers on the same level. It is very much like the "trampoline" described in the second part of this guide.
Both the stop-losses and the "trampoline" indicate a downward move, but we have the "three-drive" pattern signaling to the upside. Following the logic, we mustn’t enter the market at the moment and wait for a better entry point.
We suppose that it happens to be a false "three-drive" pattern with a small bounce off the trend line and a further breakout to the downside.
We shall open a Sell trade when the price moves a slightly higher and an additional signal occurs. We need to wait for the price to take the bounce and a similar picture shown in the order book to appear:
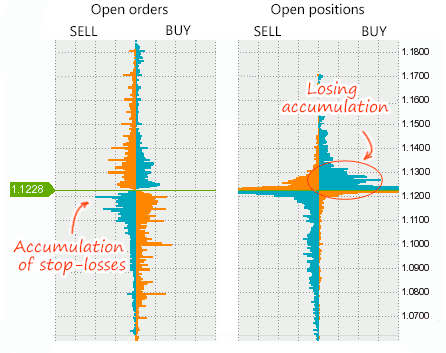
By the way, we may use those stop-losses, which we must keep in mind, as a target level (1.1150) for the reason that we expect a price to approach the level. Besides, the stop-losses are at the local low that makes them even more attractive as a target.
This is the forecast itself:
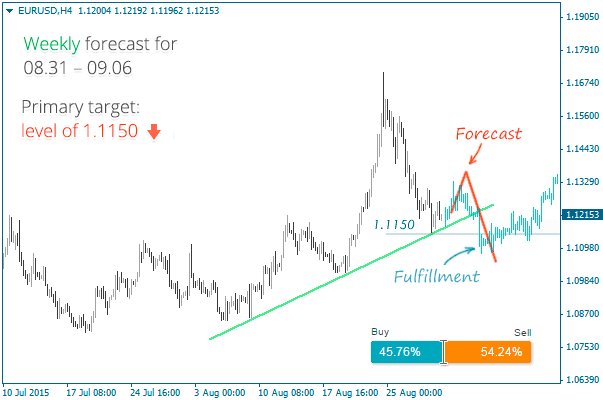
The fact that the price will bounce off the trend line and then break through it to the downside has been taken into account while making the forecast.
As you can see, analysis of this kind is very subjective. When you trade, you’re offered a puzzle with several solutions that you must solve.
Example 3 – Next Week
The previous forecast that price is going to move to the downside has fulfilled and the next week begins.
Technical analysis for this week hasn’t changed much – the trend line has been broken through by the trend line:
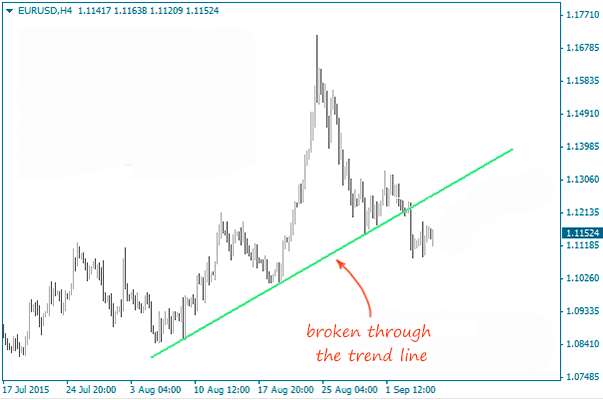
Do you think price is going to move lower or take a bounce? Let’s look at the Order Book to know more:
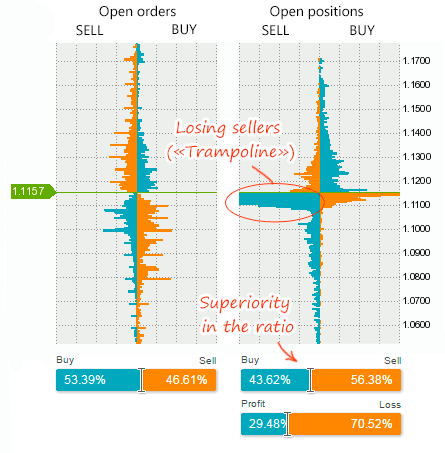
We can see an enhanced activity of sellers below the price – it signals that the downtrend becomes too obvious. The time may have come for a bounce.
In addition, there are no buyers, which could cap the move to the downside, above the price.
Lastly, the Current Ratio favors us this time.
It seems like we have determined the price direction, but we don’t know how far the price bounces.
In this case, we have set a target level beyond one of the highs where the rudiments of stop-losses’ accumulation can be observed. As for a take-profit, we mainly set it according to this method.
Here is the forecast and its fulfillment:
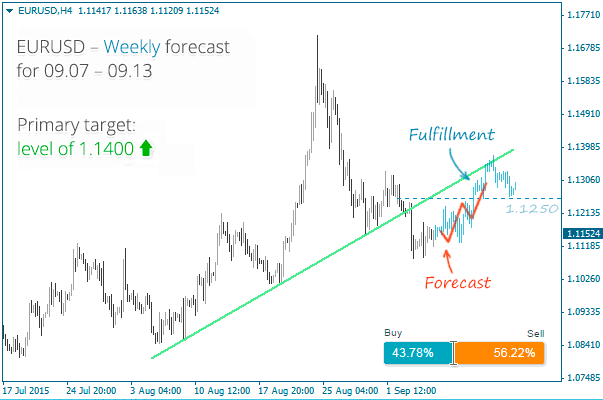
As you can see, the price has almost immediately moved to the projected target.
Resume:
We haven’t used all the available signals generated by the order book in these examples but only demonstrated the method of analysis along with technical analysis.
We repeat once again: order book and trading are very subjective as a whole – they show different results. You’ll not be able to put it into practice at once no matter how much examples we provide for you. Only your own mistakes will help you to master this knowledge and turn it into a winning trading strategy over time if you have the desire to do it but not only a thirst for taking a quick profit.


