Order Book. Part 4. – DOMs Signals
In the previous parts of this guide, we have mainly studied a visual analysis of the order book. However, it has derivatives data in a digital form in addition.

It might be interesting for you to know how many traders hold Buy positions now and what the percentage of these traders is in profit currently.
You won’t be able to calculate these figures manually, so we have developed DOM snapshots tools that can do it automatically.
You can read the description of the tool itself here, and in this article, we’re going to tell you about the signals which can be generated by it.
Let’s begin with the most common thing in Trading Against the Crowd strategy.
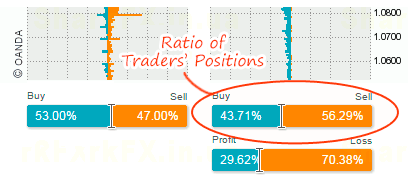
Buy-Sell Positions Ratio
We usually call it simply a “ratio”.
A theory (and it was proved by us) states that price moves against the sentiment of most traders.
So, if we know that the ratio of Buy to Sell positions is 60% and 40% we can expect a decline in the price of the given asset in the future.
The ratio is displayed here in the DOMs tool:
Now let’s proceed to a comparative analysis of the ratio and the order book itself.
In other words, it is essential to see location of positions in the order book in addition to the analysis of the ratio itself. Let’s consider this example:
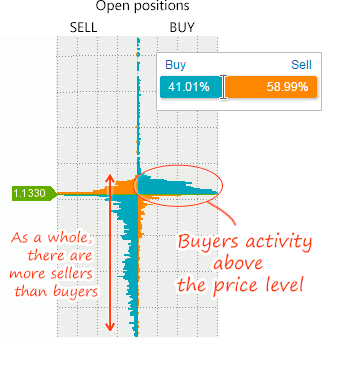
Background. There has been a long-lasting uptrend. Now we face a choice: the price will either keep moving upward or make a retracement… Let’s analyze the order book and the ratio.
The ratio shown in the picture above indicates a possible buying opportunity since most traders are short now. But let’s look at the balance of power.
What can we see? Sellers which account for the majority of traders have spread over the entire height of the order book and Buyers have been grouped slightly above the price. At that, the number of Buyers far exceeds that of Sellers above the price. It indicates that the trend becomes too evident and there are a great many traders who wish to "jump on the last car".
When the laziest trader attempts to earn money on trend, the price usually reverses.
In principle, it doesn’t make sense whether it is a retracement or a reversal – price will move downward in this situation.
We suppose that there is the logic behind it and you’ll agree with us, but now we are going to show you a situation when the above described will not work.
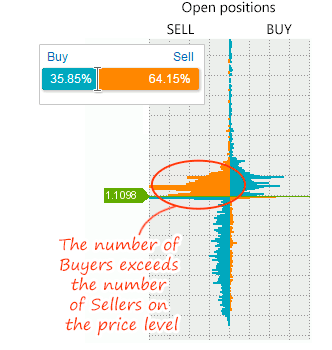
The situation is similar to that displayed in the picture above except for a specific detail. In the first case, there have been the majority of Buyers above the price; as for the second case, we can see that there is a dominance of Sellers in addition to an accumulation of Buyers.
The situation can be interpreted based on two theories:
- The first one states that the market crowd is not allowed to make money: accordingly, the price will move upward not to let Sellers close their trades in profit.
- The second (classical) one suggests that Sellers will close their trades with Buy trades and thereby push the price upwards.
It doesn’t matter which of the theories you support – both of them indicate a rise in the price in the given situation.
The last and virtually win-win situation is as follows: we call it like this – "sellers have been packed and the rocket is being prepared for launch".
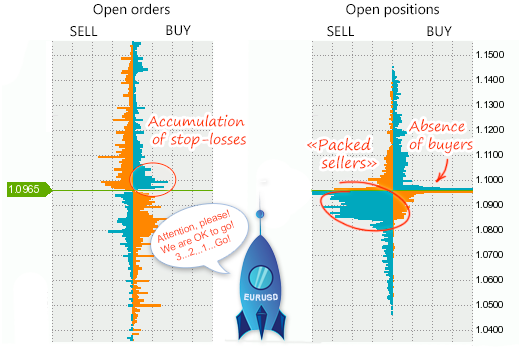
Note that there are also no any obstacles in the form of obtrusive buyers above the price.
We mean to say by these pictures that the ratio is a useful thing that works well but there are situations where trend reverses and the ratio generates false signals. If you simultaneously look at what’s happening in the order book, you’ll be able to filter out false entries.
Winning-Losing Traders Ratio
We have put the ratio (between the positions colored in orange and blue) in the right-side order book for the ease of understanding. Positions of orange color are winning positions, and positions of blue color are losing positions (it doesn’t matter whether or not they are Buy or Sell positions).
In the DOMs tool the ratio of winning to losing traders is shown here:
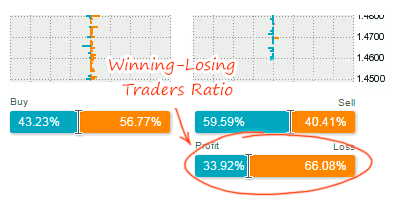
Next, we’ll call it a Profit Ratio for simplicity.
As we mentioned before, winning traders close their trades faster than losing ones, so losing traders will always outnumber winning traders. Usually, the ratio is 35% to 65%.
At that, the ratio depends much on a certain currency pair. In the previous part of this guide, we told you that every currency pair displayed in the order book has a unique character.
There are two options of how you can apply the profit-ratio in the course of trading.
The first one is to identify the time when Stop orders are knocked out from the market.
Knocking out is a false price move in one direction intended to clear the market from excessive players for the purpose of a further move in the opposite direction.
When analyzing a naked chart, it is hard to understand if there is a “knocking out”. However, if you apply the Profit Ratio, you can deal with it very easily.
Let’s consider the following situation:
It looks a lot like fishing: first, bait is thrown (move the price down) and then "a fish is stricken and pulled upward".
Therefore, the winning-losing traders ratio signals both points of reversals and beginnings of retracements well.
If we create a chart based on the data provided by the profit-ratio, we’ll see these signal points in action:
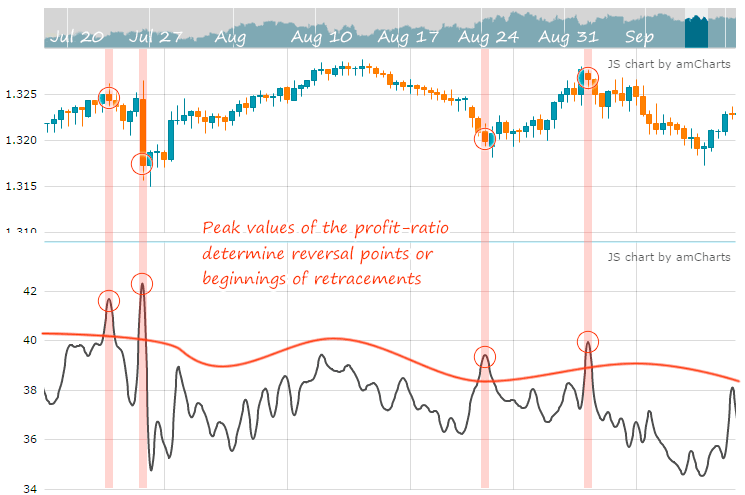
The problem is that we don’t know when the highest peak occurs … If this is the case, we need to look at what’s happening in the order book.
The second option of using the profit-ratio is to analyze it as an indicator of trend obviousness. When the percentage of winning traders increases during a price move, it means that the move itself becomes too obvious and the price will reverse soon.
On the other hand, if the percentage of winning traders decreases during a price move, it indicates that the market crowd ignores the move and expects a price comeback, but the comeback doesn’t happen.
In simple words, when a price move is false, the percentage of winning traders increases; when the move is true, the percentage decreases.
The easiest way to explain it is to display it in the picture:
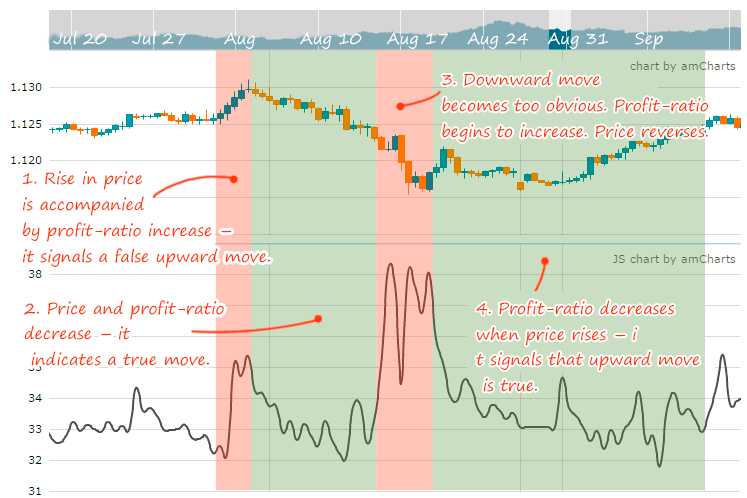
At the moment, you should analyze the this in the Profit Ratio tool where you can also determine peak values, increase and decrease of the given indicator.
Levels
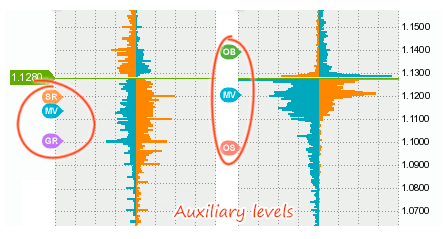
The DOMs tool also has other derivatives in form of levels:
- Middle of the Volume (MV) displays the level where 50% of the total volume both of orders and positions is. The MV can be regarded as a trend direction indicator: if the MV is below price, the trend is upward; if the MV is above price, the trend is downward.
- Overbought (OB) and Oversold (OS) levels are the levels where more than 80% of buyers are in profit for the OB and more than 80% of sellers are in profit for the OS. Price approaching the levels indicates a possible, but not a guaranteed reversal. These levels work well during a sideways trend and work worse if there is a strong trend.
- Gravity (GR) is an automatically calculated and the largest accumulation of stop-losses.
- Support/Resistance (SR) is an automatically calculated and the largest accumulation of Limit orders.
- Return Point (RP). Return Point points us to the level with a minimum number of winning traders. Details.
Thats it!
We warn you that if you “take the field” immediately after reading this guide you’ll “lose a battle”. Knowledge is not enough – you’ll also have to gain experience which takes time. Don’t be so hasty and you’ll do it well.
The next part of guide.