Profit Ratio - Overview
The Profit Ratio tool is a simple yet powerful tool for Forex traders. It shows the percentage of traders who are currently in profit at specific time or candlestick.
In Forex trading, accurately identifying trend reversal points is crucial, as they enable traders to enter the market early and maximize profits. Stochastic indicators are commonly used for predicting these reversals. However, among market sentiment indicators, the Profit Ratio has proven to be highly effective. By studying the changes in the Profit Ratio, you can identify the most optimal points for reversals, allowing for precise market entry.
Additional articles you should read before you start trading with Profit Ratio tool:
- Sentiment Strategy: Beginner’s Guide;
- Return Point, or the Point of the Maximum Loss;
- Order Book Guide – (Series of five articles);
- Stereotypes of the Market Crowd Behavior.
How to Interpret Profit Ratio Readings
This tool offers a set of data for you to analyze:
- Percentage of traders in profit (Profit Ratio).
- Profit ratio split into buyers and sellers (values from 0 to 100%).
- Profit ratio split into buyers and sellers (percentage of the total trading volume).
- The difference between the current and previous values of Profit Ratio (Delta).
- Return Point in the dynamics (Return Point).
- Ratio of open positions of traders (Ratio).
Let’s take a closer look at each one.
Percentage of Traders in Profit (Profit Ratio)
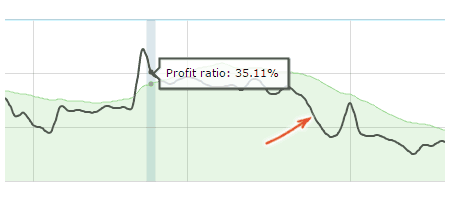
The Profit Ratio is a key part of this tool. It helps create clear signals to identify when the market might change direction or different kinds of situations where traders are “knocked out” of their positions.
It is calculated as follows:

For each update in the Order Book, the tool calculates what percentage of traders are making a profit. These percentages are then put into a chart, which you can see above.
Here’s how to interpret the analysis:
- When the Profit Ratio (shown as a black line) crosses out of the green zone, it indicates a potential market reversal.
- The direction for trading is based on the previous bar’s movement: buy if the bar was moving downward, and sell if it was moving upward.
It’s important to note that the green signal zone is simply an average value with a slight adjustment. This signal line is primarily useful for beginners. More experienced traders might prefer to turn it off for their analysis.
Profit Ratio Split Into Buyers and Sellers
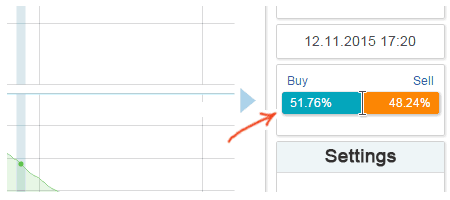
This chart displays the division of the Profit Ratio between winning buyers and winning sellers.
There are two ways to display this data:
- From 0 to 100%. For example, Profit Ratio = 36%, from which 65% are buyers and 35% are sellers (100% in total).
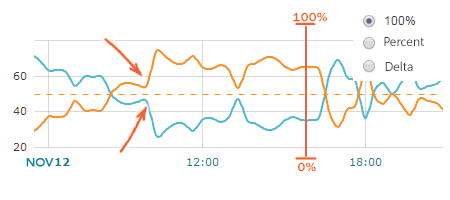
- Percentage of the total trading volume. For example, Profit Ratio = 36%, in particular 26% are buyers and 10% are sellers (36% in total).
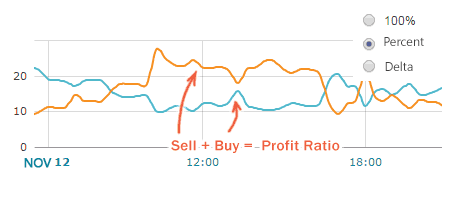
In the settings panel, you have the option to toggle between two types of charts.
Here’s the approach to analyzing this charts:
- If the Profit Ratio spikes high and the majority of winning traders are sellers, it’s an indication to buy.
- Conversely, if the Profit Ratio spikes high with predominantly winning buyers, it suggests selling.
- When the Profit Ratio stays below the signal line, dominant buyers suggest an upward trend, while dominant sellers indicate a downward trend.
[ads slot=”ssi-in-article”]
Delta Profit Ratio
Delta is the difference between the current and previous values of the Profit Ratio.
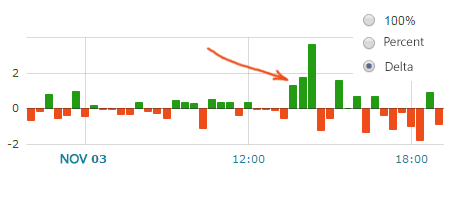
This chart shows noticeable spikes in the Profit Ratio.
To analyze these spikes:
- If the Delta (the change in Profit Ratio) is over 2%, it could signal a potential market reversal.
- Decide on the trading direction based on the previous bar’s trend: buy if the bar was trending downward, and sell if it was trending upward.
Note: The 2% value is specifically chosen for the EUR/USD pair. For other currency pairs, the ideal percentage for Delta may vary.
Return Point
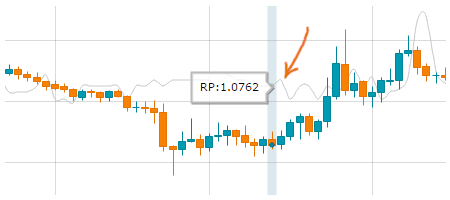
The Return Point is the hypothetical level at which the number of winning traders would be the smallest.
We have a dedicated article on the Return Point.
Here’s our approach to analyzing it:
- Place your Take Profit at the level of the Return Point.
- Use the Return Point as a guide for direction. Buy if the Return Point is above the current price, and sell if it’s below.
Keep in mind that the Return Point is less effective following a strong market impulse, so it’s advisable to use it in a more stable, flat market.
Ratio of Open Positions of Traders
The picture shows the ratio of open positions of traders for Order Book. Here is an article describing this indicator.
This is how we analyze it:
- If most traders are long, you should sell.
- If most traders are short, you should buy.
In this tool, the ratio of positions plays an important role in the filtering of signals. For example, if the profit ratio’s value has “gone through the roof” and shown that winning traders are mostly sellers, but we can see that only 30% of traders in the market are sellers, it is better to ignore this signal.
Profit Ratio Tool Interface

Historical Chart. There is a small chart above the main chart that allows you to navigate through historical data for up to 6 months.
Panel 1: This includes a price chart and a chart of the Return Point, offering a visual representation of market movements.
Panel 2: Features the Profit Ratio chart and signal zone, giving traders a clear view of market sentiments.
Panel 3: Displays the percentage of sellers and buyers, either separately or as a delta, providing a deeper understanding of market dynamics.
Currency Pairs. Here is the list of available currency pairs for this tool:
- AUD/JPY;
- AUD/USD;
- EUR/AUD;
- EUR/JPY;
- EUR/USD;
- GBP/JPY;
- GBP/USD;
- NZD/USD;
- USD/CAD;
- USD/CHF;
- USD/JPY;
- XAU/USD;
Snapshots time. Displays the time at which the current snapshot of the data was taken. If you hover your mouse over the chart, this time display will update to show when the snapshot for that specific candlestick, the one under your cursor, was created.
View Options. Several toggles for enabling and disabling features such as the Return Point and Signal line.
The “Refresh” button on this tool refreshes the data, providing you with the latest information for Profit Ratio indicator.
The Profit Ratio tool primarily produces signals for trend reversals that are relatively accurate compared to traditional stochastic indicators. Given that the data updates every 20 minutes, it is best suited for short to mid-term trades, targeting ranges between 20 to 80 pips.


