Ratios - Overview
The FXSSI Ratios tool helps you understand how the Forex market is feeling right now by showing the balance of trading positions from different brokers. It lets you look at traders’ open positions over time using a chart.
The tool also provides the flexibility to display data from one or several brokers simultaneously. Moreover, an average value is available for enhanced analysis.
This indicator is known by several names, all meaning the same thing, such as Market Sentiment, SSI (Speculative Sentiment Index), Buy:Sell Ratio, Open Positions, and others.
Additional articles you should read before you start trading with Ratios tool:
- SSI in Forex Trading – Everything You Need to Know;
- Order Book Guide – (Series of five articles);
- Does the Ratio of Open Positions Work?
- 3 Strategies for Analyzing the Ratio of Open Positions;
- Sentiment Strategy: Beginner’s Guide;
- Stereotypes of the Market Crowd Behavior.
How to read Ratios data
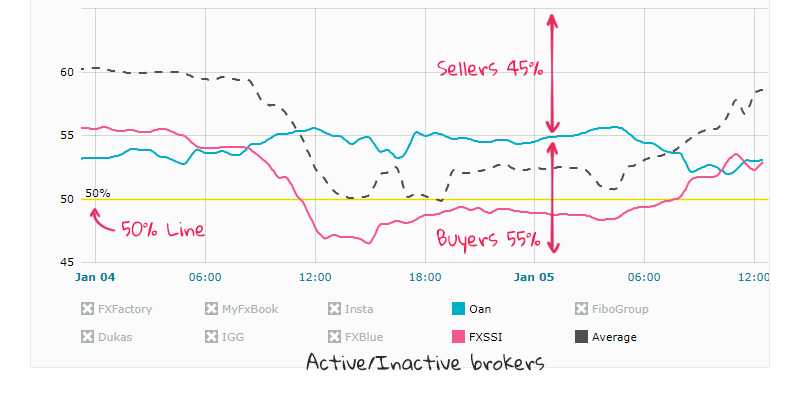
The lines you see on the chart represent the percentage of Buyers. Since the total percentage value of short and long positions is equal to 100%, you can easily calculate the percentage value of short positions by subtracting the percentage value of long positions from 100%.
You should search for various patterns in the indicator’s readings, some of which are described in the above articles. For instance, a straightforward strategy would be:
- Buy when the ratio line falls below 40%;
- Sell when the ratio line exceeds 60%.
SSI is typically viewed as a mid-term indicator. If it doesn’t fit your strategy timeframe, you can use it as a guide:
- Prefer buy trades when the ratio is below 50%;
- Prefer sell trades when the ratio is above 50%.
By merging the data from various brokers and taking into account the Average ratio, you can generate strong trading signals. This approach of consolidating information provides a more comprehensive view of market trends, leading to more reliable and informed trading decisions.
Ratios Interface
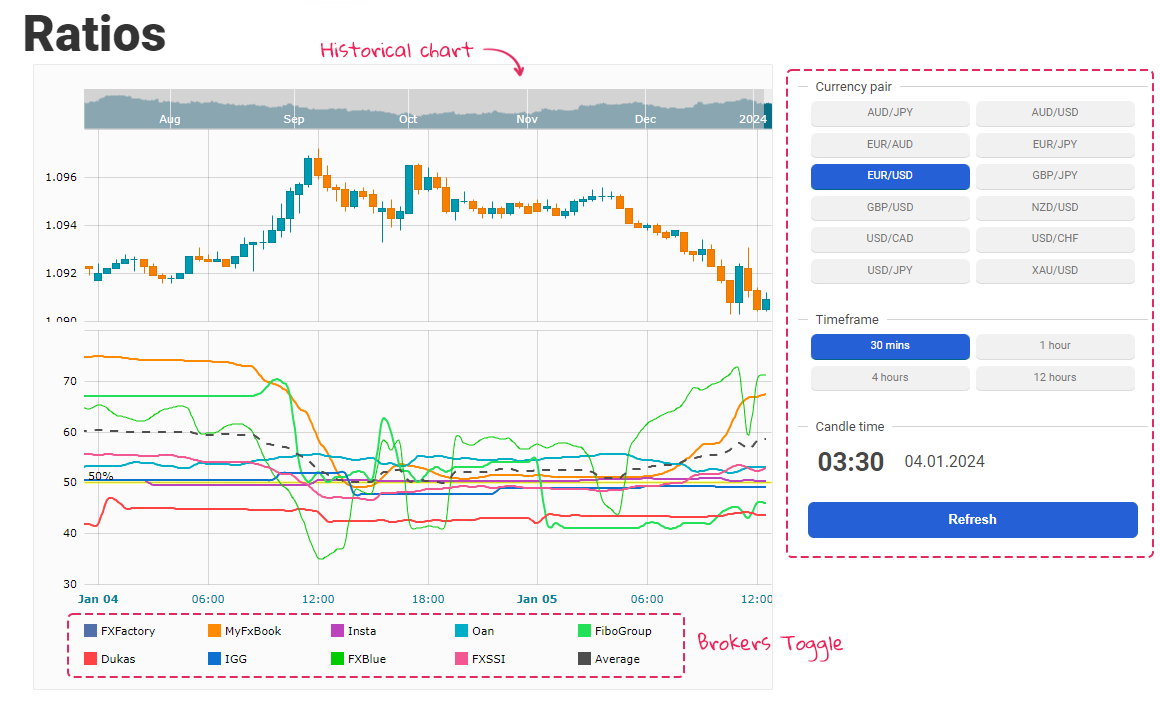
Brokers Toggle. In this menu, you have the option to disable or enable any specific broker, or the average line.
Historical Chart. There is a small chart above the main chart that allows you to navigate through historical data for up to 6 months.
Currency Pairs. Here is the list of available currency pairs for this tool:
- AUD/JPY;
- AUD/USD;
- EUR/AUD;
- EUR/JPY;
- EUR/USD;
- GBP/JPY;
- GBP/USD;
- NZD/USD;
- USD/CAD;
- USD/CHF;
- USD/JPY;
- XAU/USD;
Timeframe. Choose the candlestick timeframe for the chart. Available timeframes include M30, H1, H4, and H12.
Snapshots time. Displays the time at which the current snapshot of the data was taken. If you hover your mouse over the chart, this time display will update to show when the snapshot for that specific candlestick, the one under your cursor, was created.
The “Refresh” button on this tool refreshes the data, providing you with the latest information for Ratios indicator.
The FXSSI Ratios Tool displays the current market sentiment by showing the ratio of Forex trading positions collected from multiple brokers. It enables historical analysis of traders’ open positions using a chart. The tool also includes an Average value feature for more in-depth analysis. It’s primarily used as a mid-term indicator, suggesting buy trades when the ratio is below 50% and sell trades when above 50%. By combining data from different brokers and focusing on the average ratio, the tool provides strong trading signals.


