Open Interest - Overview
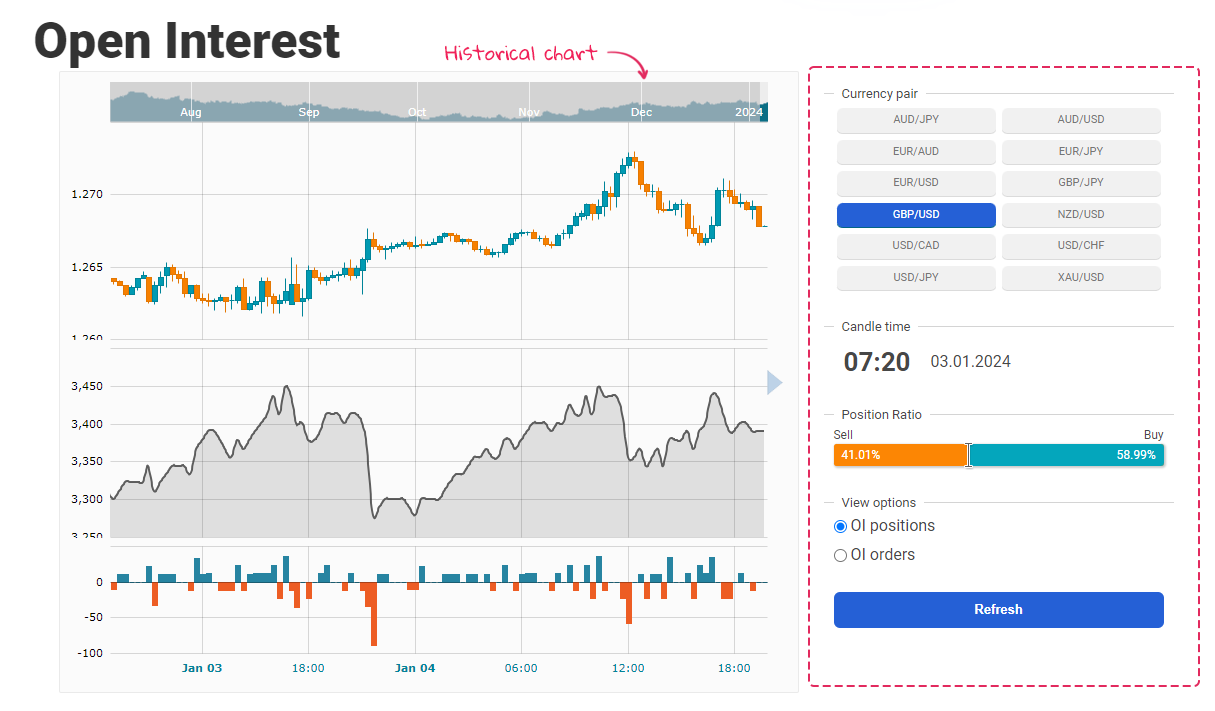
The FXSSI Open Interest Tool shows the total active trading volume in the market over a 20-minute period. Presented in a chart format, Open Interest indicates the number of trades or orders that are currently active in the market and have yet to be closed or executed.
This information is primarily used to comprehend the accumulations and distributions of trades in the market, revealing the potential liquidity of the asset. A lower Open Interest suggests higher volatility and unpredictability in movements, and the opposite is true for higher Open Interest.
Additional articles you should read before you start trading with Open Interest tool:
- Order Book Guide – (Series of five articles);
- Sentiment Strategy: Beginner’s Guide;
- Stereotypes of the Market Crowd Behavior.
How to Read Open Interest charts
This tool offers a set of data for you to analyze:
- Open Interest charts,
- Delta charts.
Let’s examine each one more closely.
Open Interest chart
This chart displays the total volume of trades or orders currently active in the market, with the volume calculated using Order Book data.
- OI Positions indicate the total number of active trades, encompassing both Buy and Sell trades.
- OI Orders reflect the total number of pending orders, including Sell Stop, Buy Stop, Buy Limit, Sell Limit, Stop Loss, and Take Profit.
When OI is high compared to previous periods, it can be seen as an indication of sideways movement and preparation for a breakout. OI tends to decrease following the breakout and during the active trend.
Delta chart
This chart shows the difference between the current and previous OI (Open Interest) values.
- Blue bar – indicates an increase in OI for the previous period.
- Orange bar – signifies a decrease in the total volume during the previous period.
Large orange bars typically suggest a breakout from a support or resistance level and the potential emergence of a trend. Consistent blue bars indicate flat or sideways movement.
Open Interest Interface
Historical Chart. There is a small chart above the main chart that allows you to navigate through historical data for up to 6 months.
Currency Pairs. Here is the list of available currency pairs for this tool:
- AUD/JPY;
- AUD/USD;
- EUR/AUD;
- EUR/JPY;
- EUR/USD;
- GBP/JPY;
- GBP/USD;
- NZD/USD;
- USD/CAD;
- USD/CHF;
- USD/JPY;
- XAU/USD;
Snapshots time. Displays the time at which the current snapshot of the data was taken. If you hover your mouse over the chart, this time display will update to show when the snapshot for that specific candlestick, the one under your cursor, was created.
Open Positions Ratio. Ratio of Buy to Sell Trades for a Chosen Candle.
View Options. Several toggles for enabling and disabling features such as the Open Interest Positions and Open Interest Orders.
The “Refresh” button on this tool refreshes the data, providing you with the latest information for Open Interest indicator.
The FXSSI Open Interest Tool offers insights into the Forex market by displaying the total active trading volume over 20-minute periods through charts.
It helps to understand market dynamics by showing the number of active and pending trades, including various types of orders like Buy, Sell, Stop Loss, and Take Profit. The tool’s ability to compare current and previous Open Interest values is crucial for traders. Blue bars on the chart indicate an increase in Open Interest, suggesting flat market movement, while large orange bars often signal a breakout from key levels and the potential start of a new trend. This makes the Open Interest Tool valuable for predicting market liquidity and movement trends.


