Order Book. Part 2. – Basic Signals
In the first part of this guide, we looked at fundamental principles of the Order Book formation. In the second part, we’re going to speak about basic signals which can be generated by the order book.

There are only 4 basic signals – 2 signals for the left order book and the same number for the right one.
#1 – Accumulation of Stop-Losses (Left Order Book)
One of the most ancient Forex legends says that major players haunt for the stop-losses of minor players. We do not know what really lies behind it: whether stop-losses are set by intuition at the levels where price is going to move to or the price follows them deliberately.
However, we can say by our experience gained during observation of the order book that price "looks" for stop-losses and causes them to trigger at the earliest available opportunity.
These stop-losses are very clearly visible in the Order Book:
But not all accumulations of stop loss orders are working. There is a set of criteria which this accumulation must correspond to so that it can be used as a signal:
- The regular shape of the accumulation can be seen in the picture below. It’s essential that it looks like a true accumulation but not a single column.
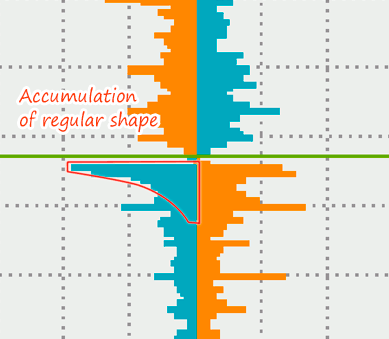
- It must be close to the current price within a range of +-100 points.
- Maximum volume is at the outset of accumulation (closer to price).
- Limit orders (in orange color) must locate lower or at the level with stop-losses. Consider an example in the picture.
- The number of Limit orders must be less or roughly the same as that of stop-losses.
It’s not particularly important to us what kind of orders this accumulation consist of (it may include Stop Loss orders and Buy/Sell Stop orders). These orders look exactly the same for market makers.
Everything described above doesn’t signal a price reversal or trend continuation but acts as a target level. In practice, we need to use such accumulations as trading targets and set take-profits at these levels.
#2 – Support and Resistance (Left Order Book)
In the left orderbook, Take Profit and Limit Orders are colored in orange. The concentration of such orders near the price can serve as a level of support or resistance.
A small number or the total lack of stop-losses at this levels is the necessary condition for the same levels to work. If stop-losses are present there, a signal will be canceled.
A practical example of support level (description is given below the picture):
- We can see an accumulation which can be taken as support in the first picture;
- Price has approached the support in the second picture;
- The price has bounced off the support and moved upward in the third picture.
These signals show you where the price will not move. However, they are less reliable and strong as compared to the signals generated by accumulations of stop-losses.
You should trade in the direction opposite from these levels in the whole.
#3 – Accumulation of Losing Trades (Right Order Book)
Not quite successful traders tend to "wait out" losing trades. They can hold a losing position for weeks just to close it at the breakeven level.
This behavioral habit creates huge clusters of such transactions. In turn, market makers like using these "stubborn" traders as a driving force.
The scheme is simple: Sheep are enclosed in a pen (loss) and then clipped to the maximum (move the price against the crowd)… Sooner or later "sheep" will have to close their trades by stop-loss or margin call and every of the closed trades will move the price against the crowd even more.
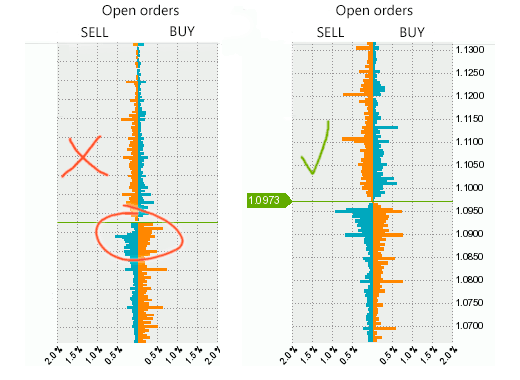
Accumulation of losing trades is displayed in blue color in the Order Book:
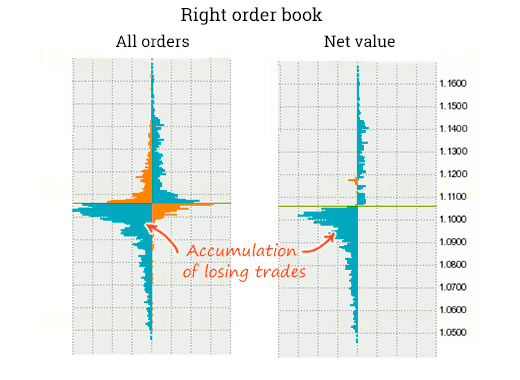
When analyzing accumulations of losing trades, it’s important to take "Net value" and "All orders" into account not to miss some information.
We can also use these accumulations as a "trampoline" which price must bounce off. The "trampoline" is the right term since price can sink deep into this accumulation before it jumps after gaining momentum.
Trampoline in action:
Note how the price has sunk into accumulation of losing trades and then reversed in the opposite direction. In other similar cases, the price may sink through the entire depth of such trampoline, for example, up to the level of 1.0900 as shown in the picture above.
Quality of the signal generated by accumulation of losing sellers will improve significantly if the same accumulation generating the opposite signals is not seen on the side of buyers and vice versa.
Why does the trampoline work for you? The answer is that when price sinks in such accumulation, losing traders begin to close their trades at the breakeven level or at profit and thereby pushing the price backward.
In addition to the price bounce, the accumulation may tell us where to set our stop-losses:
Such being the case, if the price hits your stop-loss, it will more likely go further.
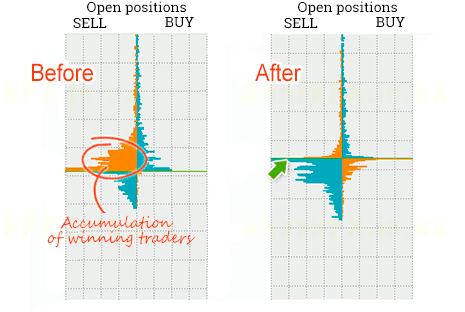
#4 – Accumulation of Winning Trades (Right Order Book)
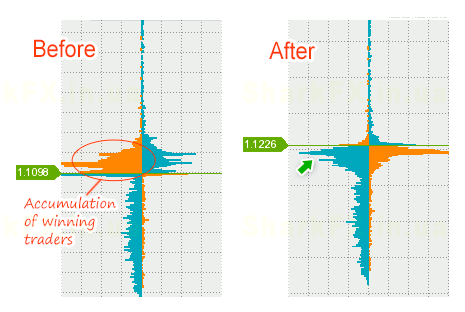
Such accumulations usually occur when deceitful maneuvers (price surges in one direction and then comes back immediately) are carried out. Large volumes of winning trades appear in the market exactly at the peak of this surge.
Winning trades are colored in orange in the order book. When there are too much of them, it signals a possible reversal. It is due to the fact that winning trades are closed much faster than losing ones, so every closed trade will push the price back.
As a rule, a cluster of winning trades stays in the market for a short while and then it either disappears or price comes back turning the profits into losses.
These accumulations are less visible in the "Net value" but can be clearly seen in the "All orders". However, the accumulation can be regarded as true if it is at least partly visible in the "Net value".
Here is one more practical example:
What Else? You Must Read It!
Take into account the fact that the Order Book should be analyzed comprehensively. You mustn’t open trades for the sole reason that there are stop-losses in the market… Better if other signals indicate the same direction.
Signals are often mutually contradictory. If you’re new to the Forex market, it would be better for you not to enter the market until you have your own rating of signals and know exactly which of these signals you should prefer at the given moment.
Don’t rush with looking for entry points since the order book generates 2-3 signals for one currency pair per week on average. At that, the average size of stop-losses and take-profits must range from 40 to 100 points.
Beware of news. The problem here is not that price will move in the opposite direction but the fact that it can significantly deviate from the projected trajectory. You will eventually find that you have chosen the right direction but your Stop order has been triggered during increased volatility. If you suddenly think that you’d better move it away from the price you’ll be wrong again.
Follow money management and don’t expect 100% payouts from trades opened based on the signals generated by the order book. According to the article, the efficiency of the order book varies from 55% to 60%. This is why you’ll certainly have losing trades quite often, but the tendency must be positive on the whole.
The next part of guide.


