“Flag” Pattern in Forex
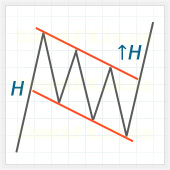
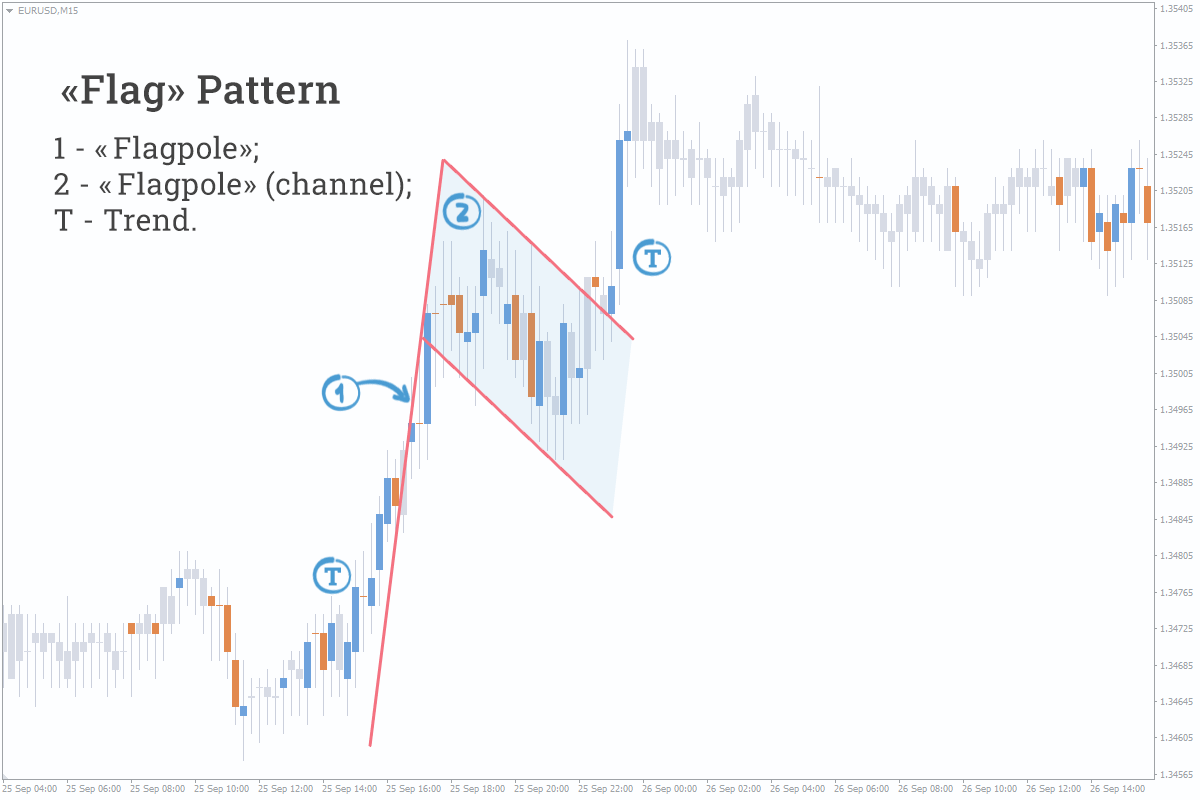
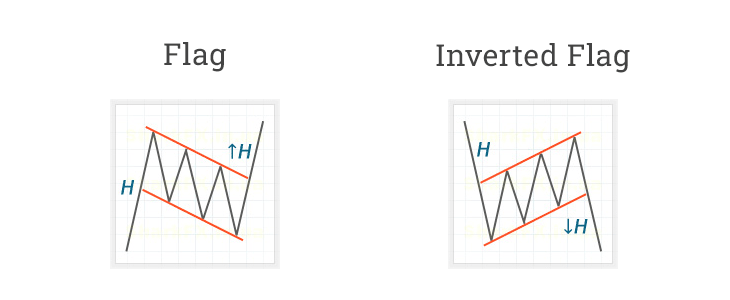
The “Flag” pattern is a technical analysis tool in the Forex trading that predicts continuation of the current market tendency (trend) and consists of two parts: the “flagpole” and the “Flag” (the channel within which the price moves).


Here is an example: If we consider the “Flag” pattern in terms of waves, the “flagpole” is an impulse, and the “Flag” itself is a retracement. When the retracement is over, a new impulse occurs and thus the previous trend resumes.
Classical Trading Strategy
The classical strategy states that the price must cover a distance equal to the height of the “flagpole” when the “Flag” pattern is fully completed and the border of its channel is further broken out.
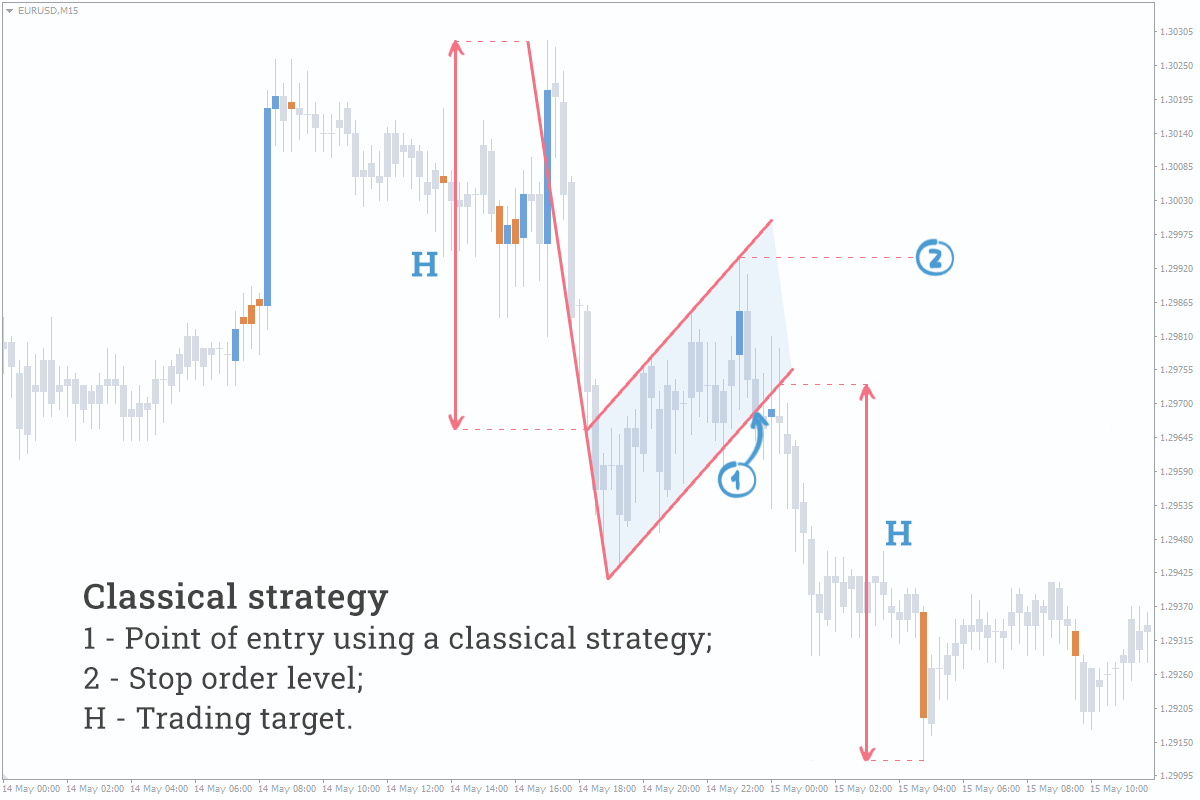
Enter the market at the point (1), when the price breaks out the channel’s border;
Trading target is equal to the “flagpole” height (H);
Stop order is set at the level of the retracement top at the point (2).
Btw, if you are looking to upgrade your terminal with pro indicators and different utilities you can browse from variety of resources available at FXSSI Product manager.
Reasons Behind the “Flag” Chart Pattern Formation
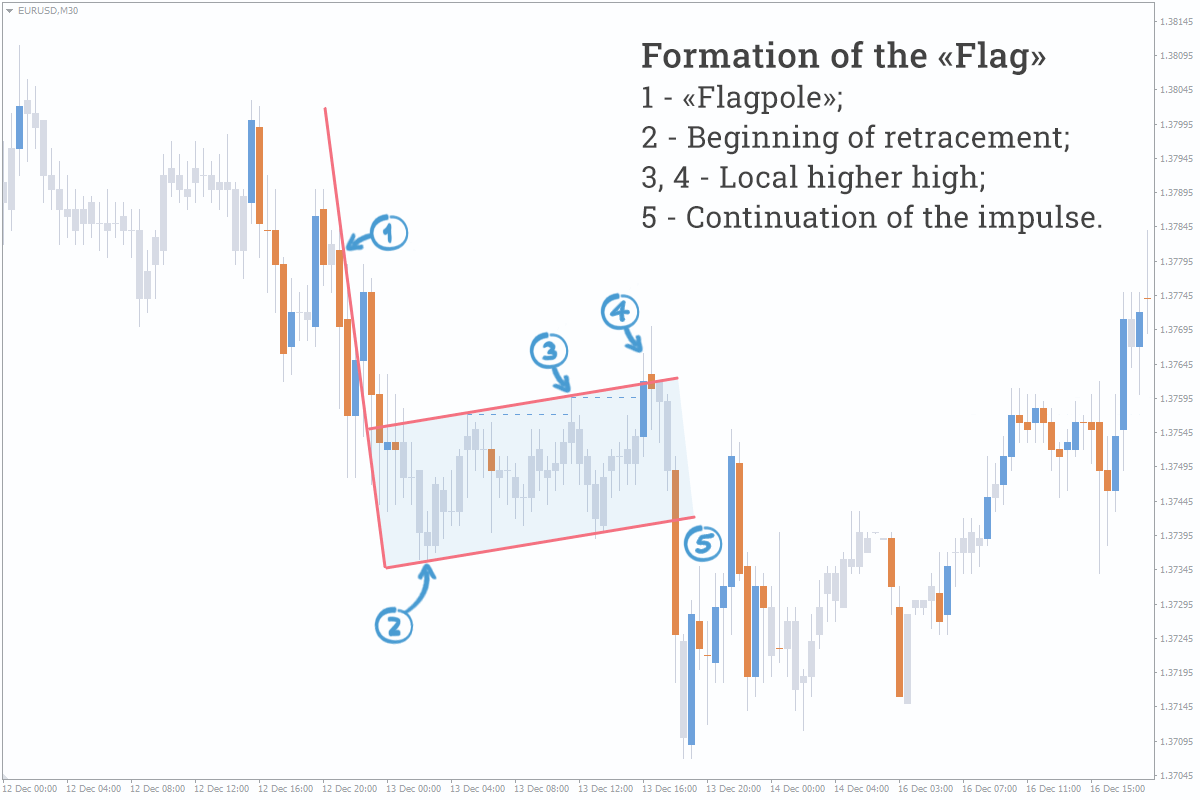
The appearance of the “Flag” on the chart is necessarily preceded by an impulse (1), but one cannot speak of a possible occurrence of the “Flag” if only the impulse can be seen. The pattern formation itself begins when the price stops following the occurrence of an impulse and starts to enter a retracement stage at the point (2).
The reason that has caused the price to stop may be both an active closing of winning positions opened before occurrence of the impulse and the desire of major players to add to their positions at the expense of the crowd’s Stop orders at the points (3,4).
When positions have been added to or the price has made a sufficient retracement (about 1/3 of the “flagpole” height), the impulse (5) is initiated towards the trend continuation.
Alternative Strategies for the “Flag” Pattern
The “Flag” is not often seen as a “Triangle” on the chart, but it’s not a very uncommon pattern there. This pattern doesn’t always look perfect in today's market, so the price model can be made simpler as follows: impulse -> slight pullback (1/3 of the impulse size) -> continuation.
Alternative trading strategies for the “Flag” pattern:
“Flag” + “ABC” Forex strategy.
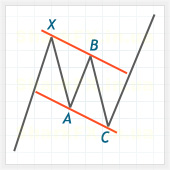
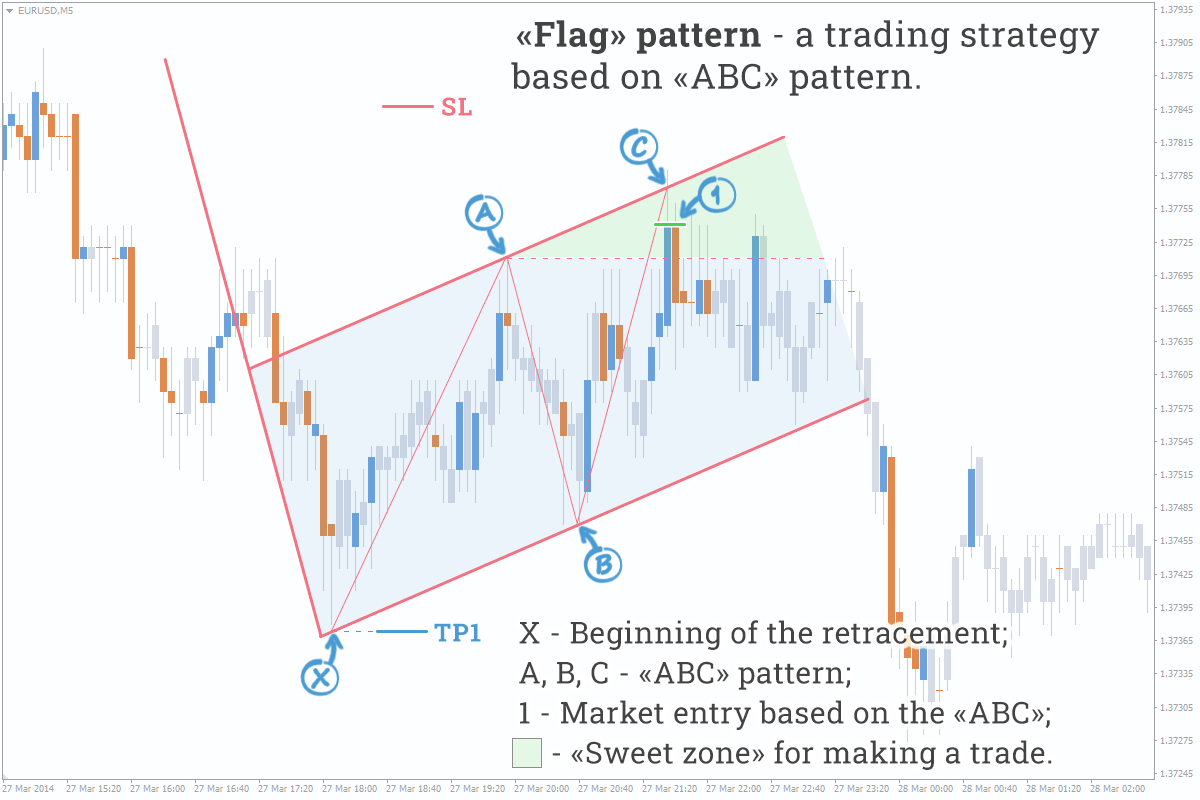
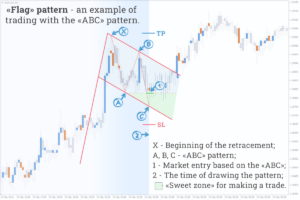
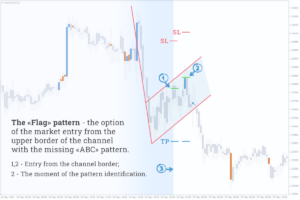
The channel that forms the “Flag” often represents the “ABC” pattern. The given strategy involves using the “ABC” pattern for more accurate entries and exits. The entry made at the level when the price has already updated the local extreme (A) and is still moving within the channel (“sweet zone” is on the right side of the chart) can be considered a successful market entry.
Enter the market (1) at any point of the “sweet zone”;
Trading target (Take Profit, TP) is set at the level of the pattern’s first pivot point (X) which is also the previous local low or at the nearest round-number levels beyond the point (X);
Stop order (Stop Loss) is set outside the channel range, but no further than the beginning of the “flagpole”.
Market entry in the “sweet zone” strategy.
Market entry rule – if there is no a clearly defined “ABC” pattern and a Buy/Sell signal, you can enter the market at the points close to the channel border (in the “sweet zone”) towards the trend continuation;
Trading target and Stop orders are the same as in the previous strategy.
We advise you not to enter the market using a classical strategy, as it is unprofitable due to its lateness. At that, a good sign that pattern will successfully materialize is high volume spots occurring during a channel border breakout, i.e. at the classical entry point.
Pattern Types
The “Flag” and the “Inverted Flag” are identical, but multidirectional patterns. They are traded by the strategies identical to those described above.
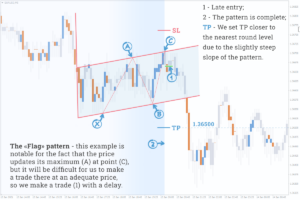
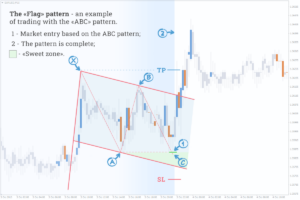
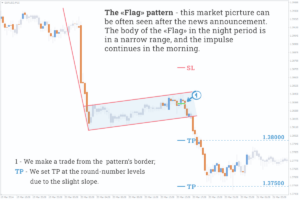
Examples of Trading With the “Flag” in Forex
Other patterns in our blog:

