MTF.HighLow
MTF.HighLow Screenshots (8)


MTF.HighLow - Overview
As a forex trader, one of the most important things you need to do is to keep track of the high and low price levels of different periods. This information can help you make informed trading decisions and improve your overall profitability.
The MTF High Low forex indicator is a powerful tool designed to draw on the chart of the MT4 or MT5 platform, the previous high and low price levels for different periods, from today to historical, and even custom periods.
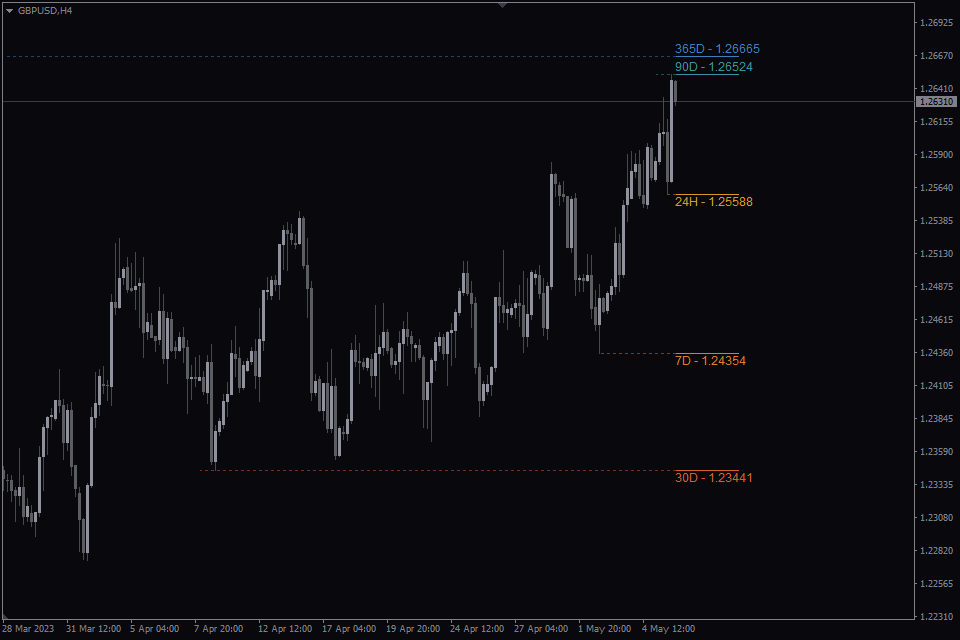
The levels are displayed as lines on the chart with the acronym of the period, and you can choose from different layout options and even add dotted projections or price tags to enhance the visibility of the levels.
Top Features of the Multitimeframe High Low Indicator
The multitimeframe high low forex indicator is a versatile tool that has a range of functions and features.
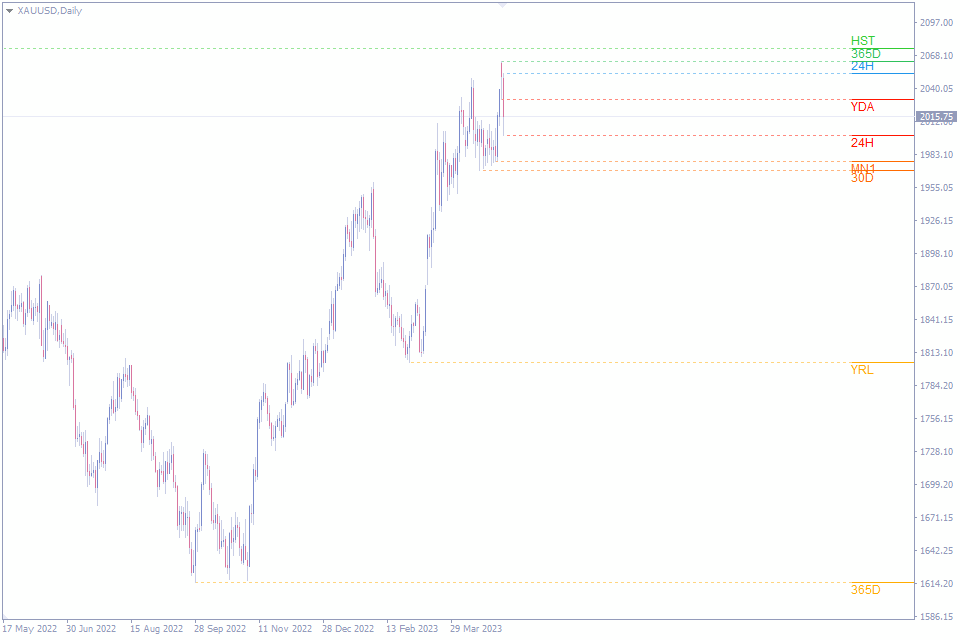
Variety of periods. The indicator draws on the chart the high and low price levels for different periods, such as today, yesterday, daily, weekly, monthly, yearly, and historical. Additionally, you can set custom periods to suit your specific trading needs.
Period acronyms list:
- 24H: 24 hours
- 7D: 7 days
- 30D: 30 days
- 90D: 90 days
- 365D: 365 days
- TDY: Today
- YDA: Yesterday
- W1: This Week
- MN1: Month to date
- YRL: Year to date
- HST: Historical
- [n]H: Custom Hours
- [n]D: Custom Days
5 layouts. The levels are displayed as lines on the chart, and you can choose from five different layout options: right side, current price (left), current price (right), full width, or from high/low to last candle.
Visual customizations. To enhance the visibility of the levels, you can add dotted projections to the high/low and even price tags to show the actual price of the level. You can also adjust the text size to suit your preferences. The indicator comes with two prebuilt color templates, both for dark and light backgrounds. You can also set custom colors for each line using the custom preset option.
Using the High Low Indicator to Identify Key Trading Levels
The MTF High Low indicator can be used by traders to identify key levels of support and resistance for different periods. These levels can be used to identify potential entry and exit points for trades, and can also be used to set stop-loss and take-profit levels.
For example, if the indicator shows that the daily high level is at 1.2000 and the daily low level is at 1.1900, a trader can use these levels to set a stop-loss at 1.1900 and a take-profit at 1.2000 for a long position. Similarly, if the indicator shows that the weekly high level is at 1.2200 and the weekly low level is at 1.1900, a trader can use these levels to identify potential entry and exit points for a swing trade.
Another effective way to use this custom High Low Indicator is with breakout trading strategies. Breakout traders look for price movements that break through key support or resistance levels, signaling a potential trend reversal or continuation. If the current price is approaching a key resistance level identified by the indicator, the trader may choose to enter a long position in anticipation of a breakout. Conversely, if the price is approaching a key support level, the trader may choose to enter a short position in anticipation of a breakdown.
Overall, the multitimeframe high low indicator is a powerful tool that can help traders make more informed trading decisions and improve their profitability.
Indicator Settings
The multitimeframe high low forex indicator comes with a range of settings that can be customized to suit your specific needs. These settings include:
Layout style. The Layout Style option allows traders to choose from five different display options for the high and low lines on their chart. These options include right side, current price (left), current price (right), full width, and from high/low to price.
- Right side option places the high and low lines on the right-hand side of the chart
- Current price (left) option place the lines on the left-hand side of the current price.
- Current price (right) option place the lines on the right-hand side of the current price.
- Full width option stretches the high and low lines across the entire chart.
- From high/low to price option draws a line connecting the high or low point to the right side of the chart.
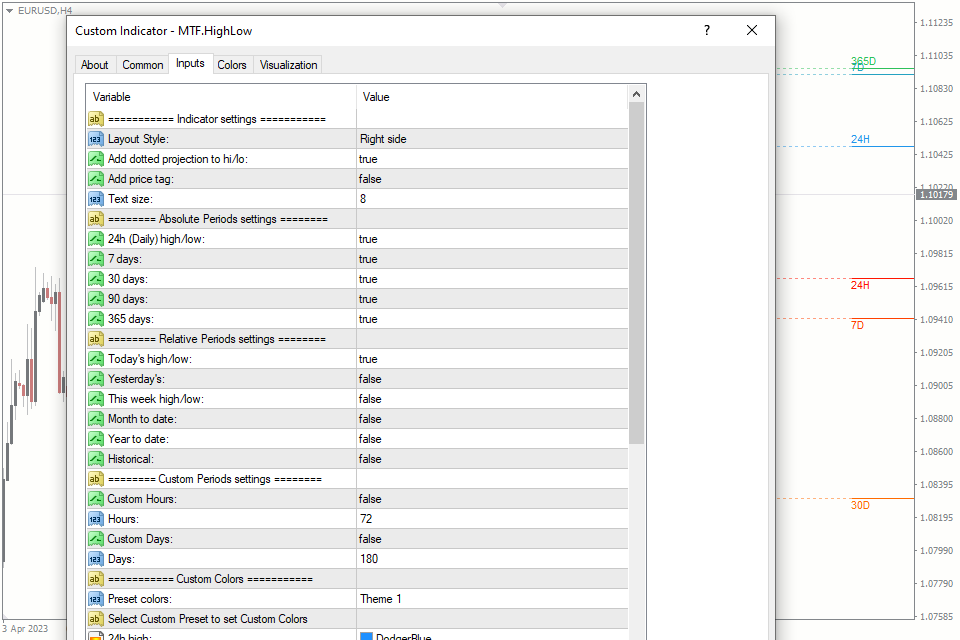
Add dotted projection to hi/lo: This option adds a dotted line from the level tag to the respective high or low.
Add price tag: This option adds the price near the acronym of the respective high or low.
Text size: This option adjusts the text size of the level tag.
Absolute Periods settings allow you to customize which periods are displayed on the chart. By activating or deactivating specific periods, you can choose to display data for the last 24 hours (Daily), 7 days, 30 days, 90 days, or 365 days.
Relative Periods settings allow you to choose which time frames you want to view data for based on the current date. You can select from a variety of periods, such as today, yesterday, this week, month to date, quarter to date, year to date, and historical
Custom periods settings: This option enables you to set custom periods in days or hours to suit your specific trading needs.
Preset colors: This option enables you to choose from two prebuilt color templates. Each color preset work both for dark and light backgrounds.
Custom colors: This option enables you to set custom colors for each line using the custom preset option.
How to add MTF.HighLow in MT4/MT5
Follow the instructions below to install the Indicator to your MT4 or MT5 terminal:
- Download the ZIP-archive with MTF.HighLow indicator file by clicking the link at the top of the page;
- Unzip the file into the MQL4/5 indicators folder of your terminal;
- Restart the MT4/MT5 terminal;
- Run the indicator by double clicking the indicator name in the MT4/5 Navigator;
- Check the "Allow DLL imports" box and click "OK";
- The indicator will be displayed on the chart;
- Adjust the indicator’s settings according to your needs: press CTRL+I, select the indicator from the list, and switch to the "Inputs" tab.
If you have any difficulties while installing the indicator, please view the detailed instruction.


