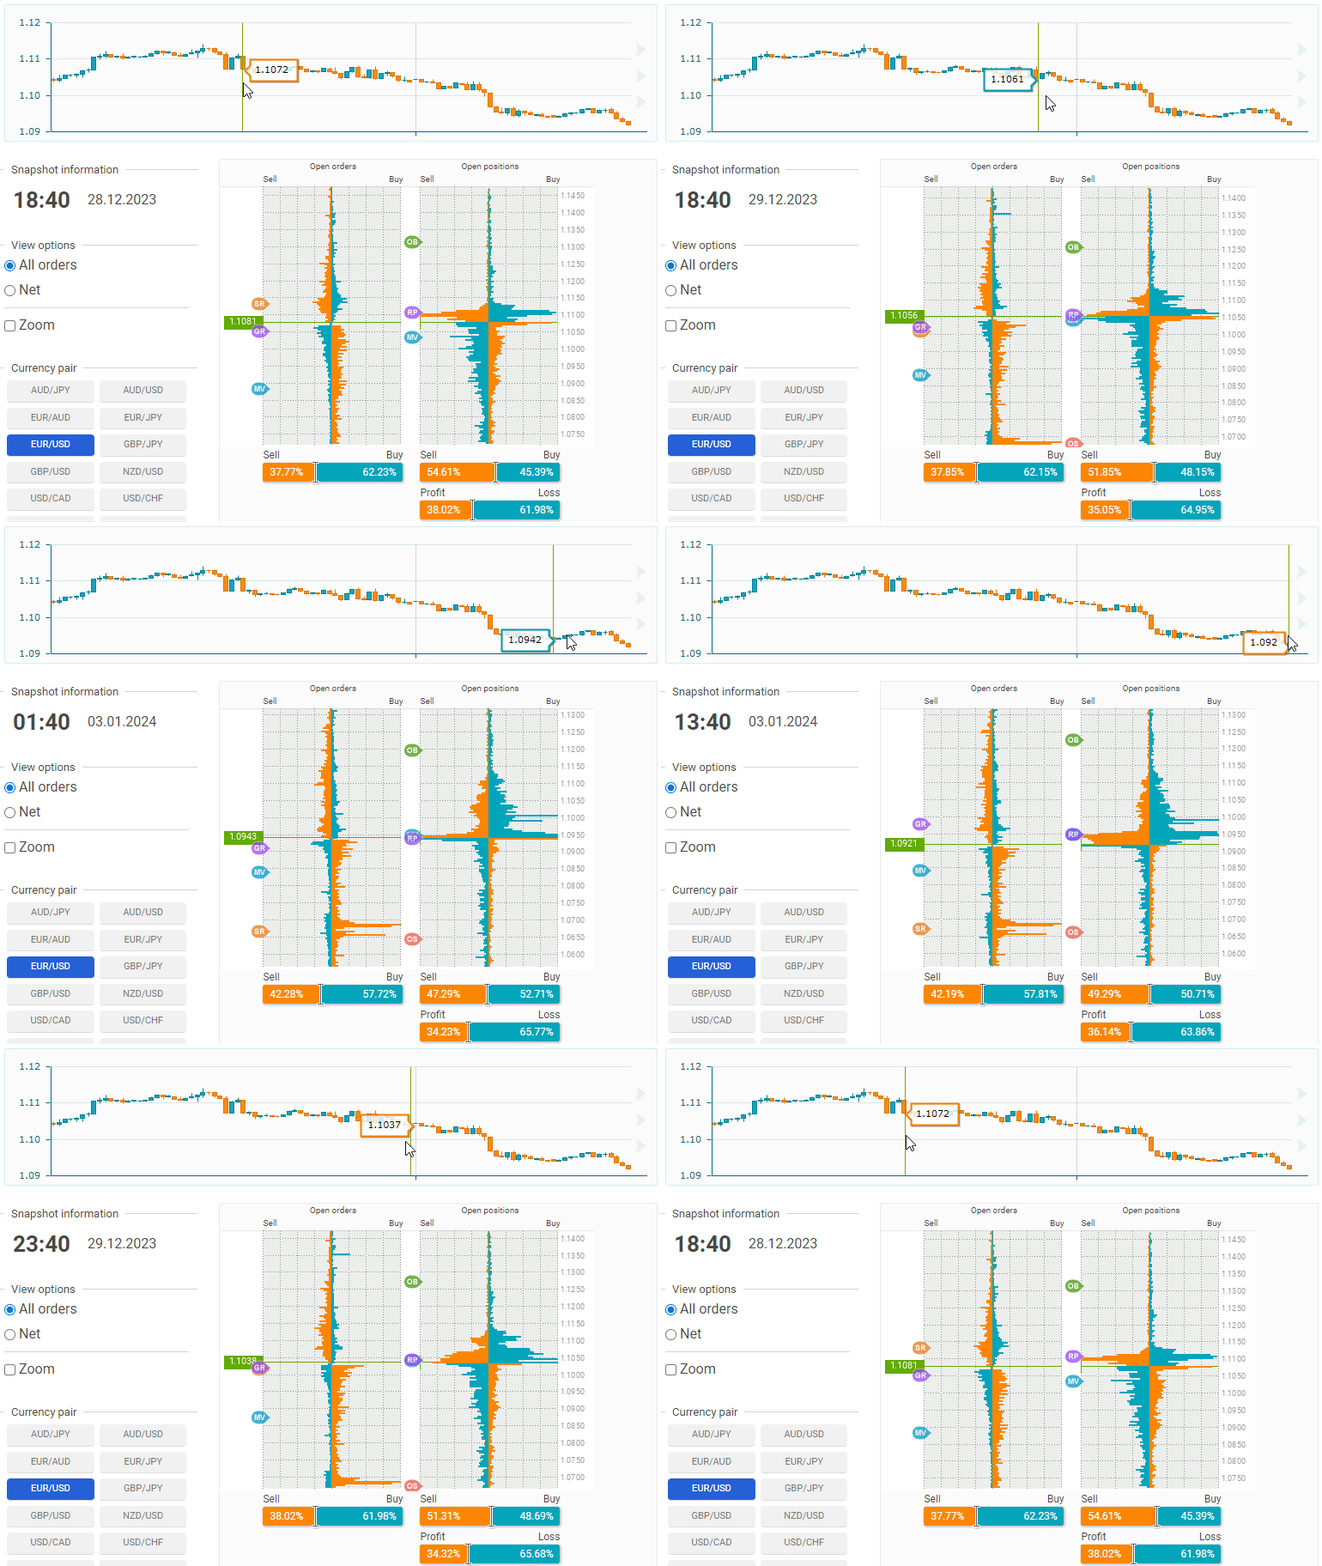
Order Book Snapshots - Overview
The FXSSI Order Book Snapshots live tool (formerly DOM Snapshots) is an advanced instrument that offers comprehensive market sentiment analysis for Forex traders.
This online indicator displays open trades and pending orders of retail traders as a two histograms. The left side of the histogram shows all pending orders, including Take Profits and Stop Losses, while the right side shows the currently open trades of market participants.
This Order Book software offers a dynamic way to analyze market trends and sentiments at Forex market. By simply moving your mouse over the chart, you can see the historical formation of the order book. This feature allows you to track how market sentiment has evolved over time, providing valuable insights into trading patterns and potential future market movements.
Additional articles you should read before you start trading with Order Book snapshots tool:
- Order Book Guide – (Series of five articles);
- Sentiment Strategy: Beginner’s Guide;
- Stereotypes of the Market Crowd Behavior.
The Order Book Snapshots tool is available for FREE and is generally suitable for entry-level traders who are learning sentiment trading. For those interested in diving deeper into sentiment analysis, explore our range of more advanced tools and indicators.
How to Read an Order Book Histogram
The Order Book is essentially a visual tool that shows the current trading activities in the Forex market. This includes information on active trades, pending orders, and Stop orders. Each of these trades is aggregated and shown at various price levels in the form of a histogram.
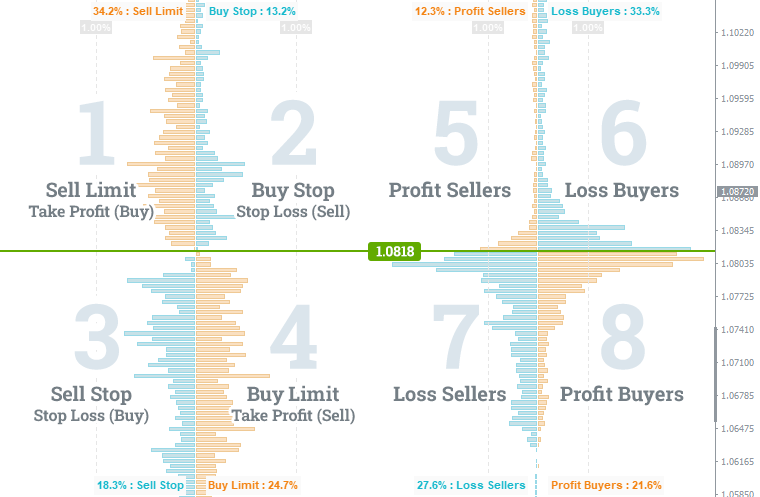
To fully cover all the trades, we divide them into two groups, which form two separate histograms: the left one and the right one. In the following picture, you can see the various orders that make up the snapshot of the Order Book.
Quadrants
For simpler understanding, we’ve divided the histogram into quadrants.
- Sell Limit, Take Profit (Buy);
- Buy Stop, Stop Loss (Sell);
- Sell Stop, Stop Loss (Buy);
- Buy Limit, Take Profit (Sell);
- Profit Buyers;
- Loss Buyers;
- Loss Sellers;
- Profit Buyers.
The green line marked with a price on the OrderBook snapshot shows the current market price at the time the snapshot was taken.
Ratio bars
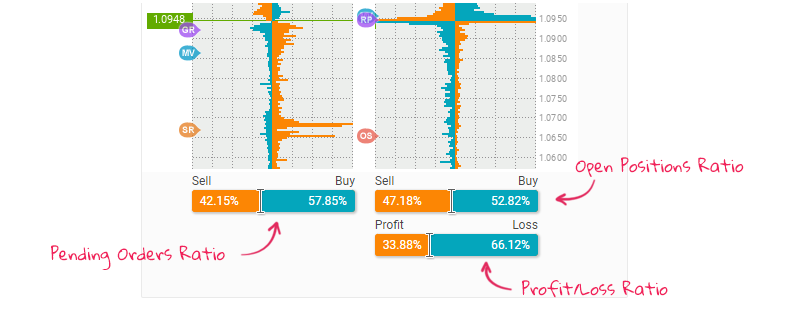
Beneath the histograms, you can find ratio bars that provide additional information.
- Percentage ratio between pending buy and sell orders.
- Percentage ratio between buy and sell positions that are still in the market.
- Ratio of Profit vs Losing trades.
These bars dynamically change as you navigate through the snapshots.
Labels
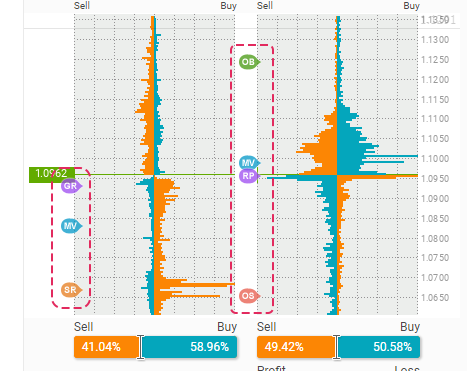
The histograms come with extra labels that offer additional information.
GR (Gravity) – the price level where the highest stop loss accumulation is located. It’s known that the price gravitates toward it.
SR (Support/Resistance) – highest accumulation of limit orders which may act like a support/resistance level. Should have much more volume than the Stop orders accumulation on the other side to be valid.
MV (Middle Volume) – For both histograms, there’s a price level indicated where half of the orders are above and half are below this level.
OB (Overbought) – Indicates the price level where over 70% of buyers would be in profit, suggesting that the asset might be in an overbought condition.
OS (Oversold) – Indicates the price level where over 70% of sellers would be in profit, suggesting that the asset might be in an oversold condition.
Order Book Snapshots Interface
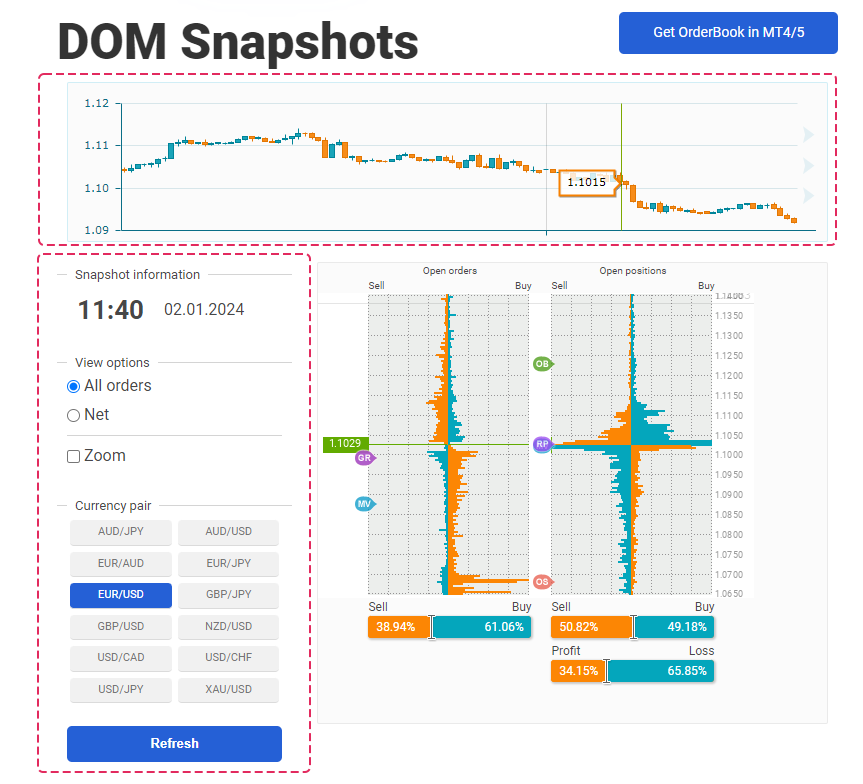
Lets look at the interface of the Order Book tool.
Chart. Navigate through different Order Book snapshots using the chart.
Snapshots time. Displays the time at which the current snapshot of the order book was taken. If you hover your mouse over the chart, this time display will update to show when the snapshot for that specific candlestick, the one under your cursor, was created.
All Orders/NET – These buttons on the indicator panel allows you to switch between the regular order book and the net version, which displays the difference between the left and right sides of the order book.
Zoom. Selecting this option will zoom in on the order book, enlarging it by 2 times for a closer view.
Currency Pairs. Here is the list of available currency pairs for this tool:
- AUD/JPY;
- AUD/USD;
- EUR/AUD;
- EUR/JPY;
- EUR/USD;
- GBP/JPY;
- GBP/USD;
- NZD/USD;
- USD/CAD;
- USD/CHF;
- USD/JPY;
- XAU/USD;
The “Update” button on this tool refreshes the data, providing you with the latest information and snapshots from the Order Book.
Understanding the Order Book Dynamics
The order book’s dynamics reveal how trading volumes change over time.
When you move your cursor over the chart in the OrderBook snapshots tool, you’ll see changes:
- In the left order book. For instance, at some price levels, the number of trades (volume) increases, while at others, it decreases or stays the same. This helps you understand which price levels are attracting more interest and where the price might move next.
- In the right order book, pay attention to how quickly Buy and Sell trades are completed at different levels. Sometimes, Buy trades close faster than Sell trades, and other times it’s the opposite.
A key piece of information comes from observing how the price first moves up or down and then returns to where it started. By comparing the order books before and after these price changes, you can often figure out the reason behind these movements.
This kind of analysis helps in understanding market trends and trader behaviors at different price points.
The FXSSI Order Book is a useful tool for Forex traders to understand market trends and make better trading decisions. It has a user-friendly design and offers important insights, making it helpful for both experienced and new traders in improving their trading strategies.
