How to Make the Best Use of the Stochastic Indicator in Your Forex Trading
Developed in the 1950s by George Lane, the stochastic indicator has grown to be one of the most popular indicators today.


And this popularity is no fluke, since the momentum data carrying indicator gives buy and sell signals with reasonably high accuracy.
The stochastic oscillator, also known as the stochastic indicator, measures the momentum of the price of an asset based on previous closing prices and price ranges over a chosen period.
But before we dig too deep into how to use it in your trading, knowing how the stochastic indicator is calculated might give you a better insight into how to actually use it.
How the Stochastic Indicator is Calculated
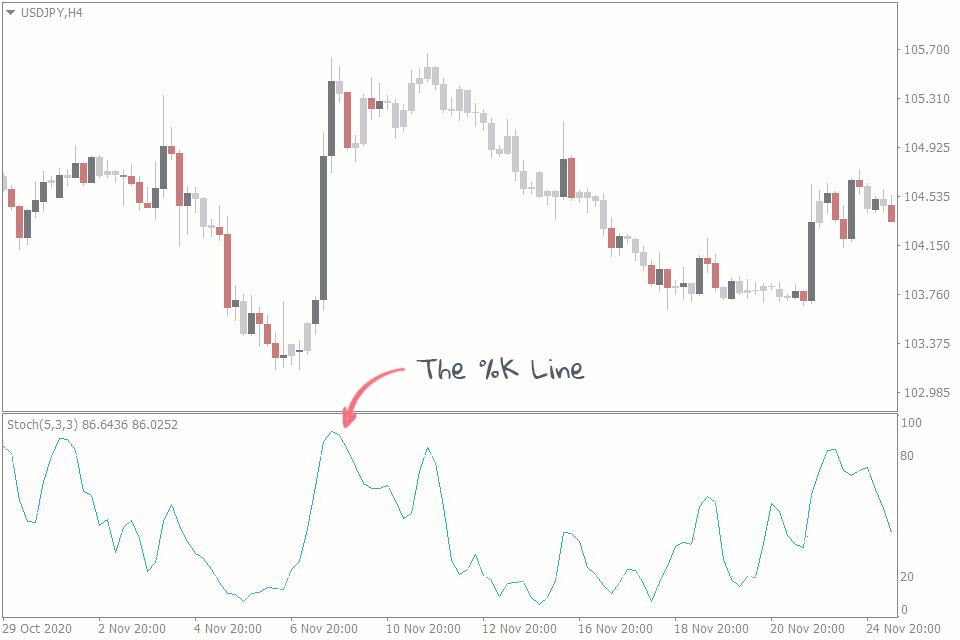
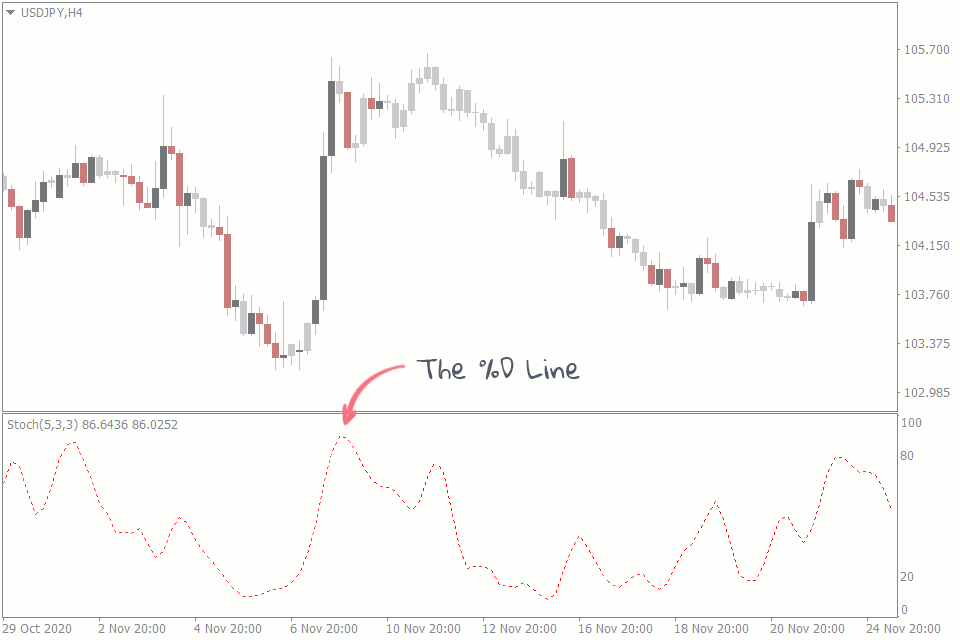
The stochastic indicator has two lines that oscillate within a range of 0 to 100. One of them is the %K line, which shows the momentum itself. The other line, %D, is a signal line, and it derives its value from the %K line.
%K = ((Most Recent Closing Price – Lowest Price Level Over Chosen Period) / (Highest Price Level Over Chosen Period – Lowest Price Level Over Chosen Period)) * 100
The period is the number of candlesticks that are used when the stochastic indicator makes its calculation. Many professional traders prefer to set their period to 14. But you may set yours to a different one and you can do this in the indicator settings.
%D = 3 – period Simple Moving Average of the %K.
As the calculation suggests, the default period here is 3. But you can tweak it to your liking.
On the chart below, the %K is the fast line, while the %D is the slow and smooth one. Apart from the oscillating lines, the stochastic indicator pegs two lines at the 20% and 80% levels of the range.
How to Trade Forex Using the Stochastic Indicator
There are a lot of ways to use the stochastic indicator, depending on your trading strategy. But the most common ways to use the stochastic oscillator include determining overbought and oversold price levels and making trades based on divergences.
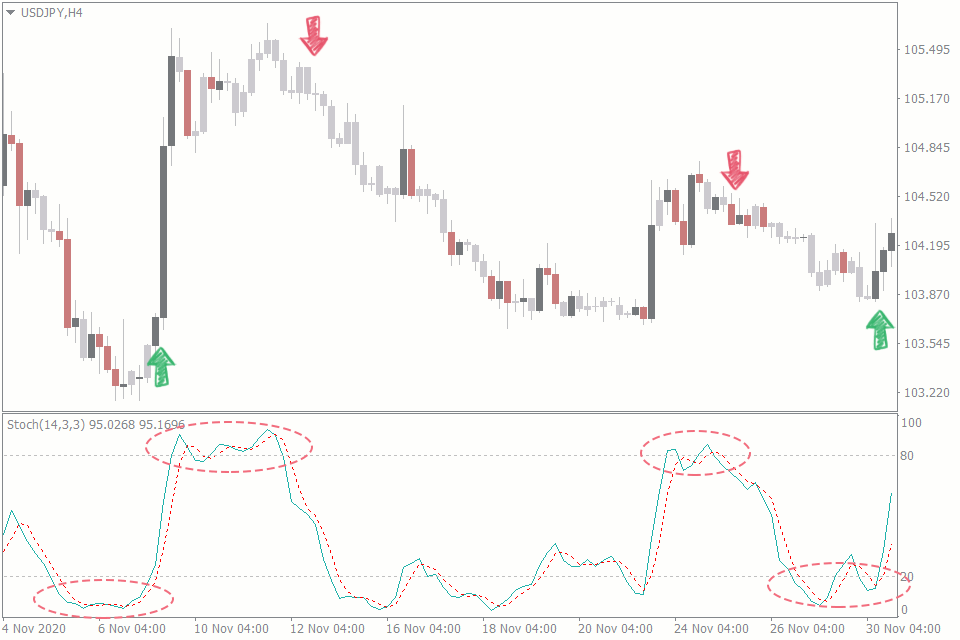
Overbought and Oversold Levels
The stochastic indicator is bound between the values of 0 and 100. But when the lines venture beyond the 80% level, it is considered to be an overbought condition. There might be a potential reversal to the downtrend. And whenever the price falls below the 20% level, it’s time to buy, because the price is in the oversold zone.
Be careful, however, when you want to buy or sell using the stochastic indicator as a part of your overbought/oversold strategy. The price can remain overbought or oversold for a long time before it eventually reverses. When you find yourself in this situation, wait for a confirmation that the price has reversed before you make your trade.
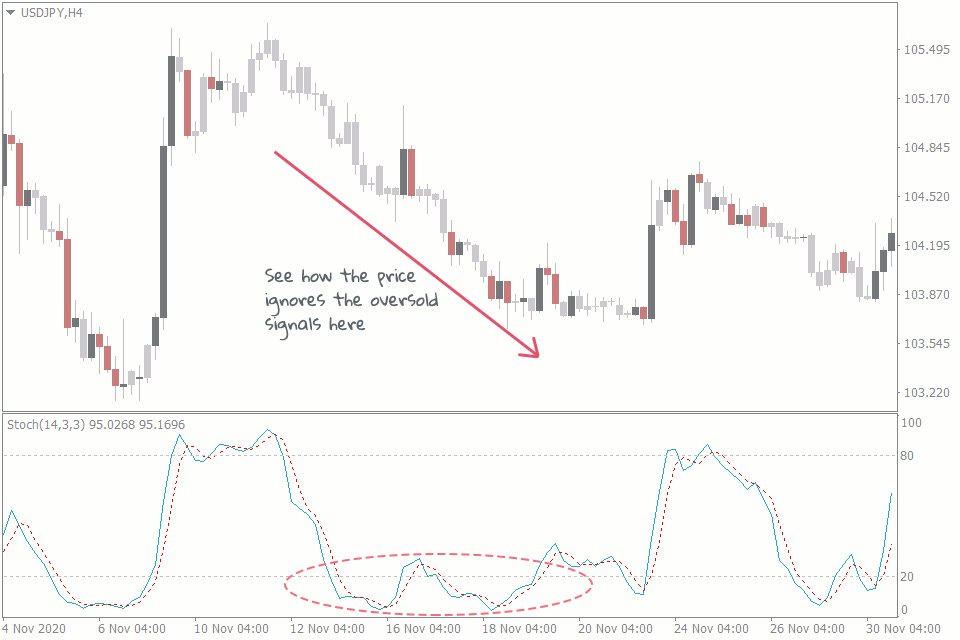
You should also bear in mind that buying or selling at oversold or overbought levels means that you are trading against the current trend. So, unless you’re a contrarian trader, wait till the price makes its reversal before you enter the trade. You may combine the stochastic indicator with another technical analysis tool to catch the reversal before opening a trade.
Divergences
Trading divergences is also another useful way to make trades using the stochastic oscillator. Its use is similar to how it works on the MACD.
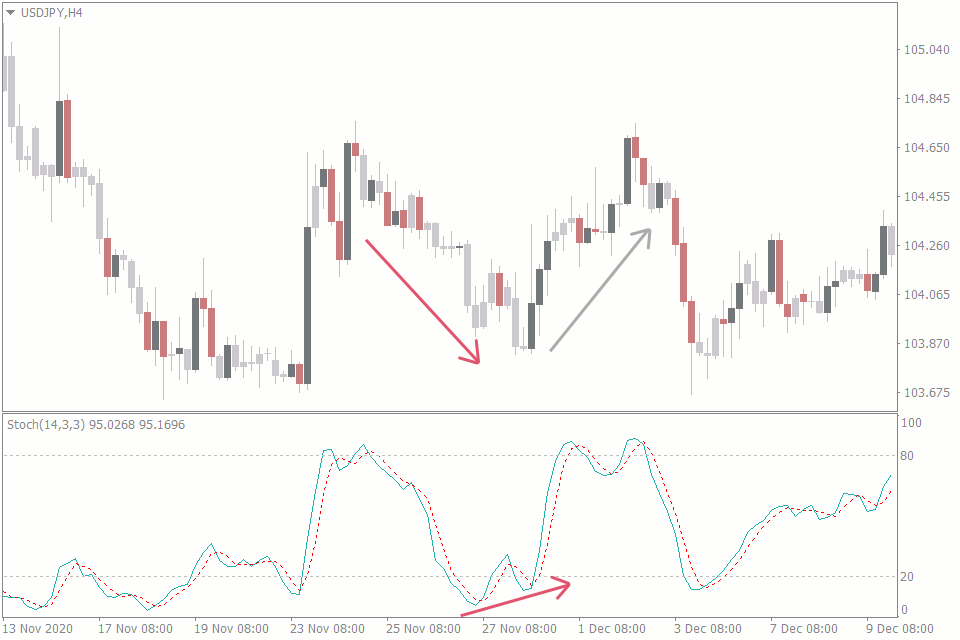
Normally, the stochastic indicator mimics the price movement. That is, the indicator trends upward when the price trends upward, and trends downward when the price trends downward as well. So, you’ll find the indicator forming lower lows when the price is in a downtrend, and higher highs will be forming when the indicator is in an uptrend.
But in some rare cases, you might find the stochastic indicator going in a different direction from the price. The price is either going up while the indicator is going down, or vice versa. We call this a divergence. And in such cases, get ready for a potential change of the price direction.
Getting High Probability Setups Using Multi-Timeframe Analysis
This strategy involves using either of the other two strategies described above, only with an added functionality. This involves the use of a timeframe higher than the one you’re currently trading at.
This strategy is based on the premise that you always want to have the “big picture” displayed on the higher time frames as you make your trades. Going against this “big picture” could be risky, as you might be disregarding more dominant moves on the higher time frames.
For instance, you might have a perfect trade setup on a 1-hour chart that implores you to sell. But if the 4-hour chart suggests that the price is in a strong uptrend, your trade may turn out to be a high-risk one.
Bonus Indicator: The Stochastic Relative Strength Index (StochRSI)
The StochRSI is a powerful combination of two strong indicators: the Relative Strength Indicator (RSI) and the Stochastic indicator. This StochRSI indicator is a more sensitive one than the RSI. And just like the stochastic oscillator, it reads oversold and overbought levels.
How the Stochastic Relative Strength Index (StochRSI) is Calculated
The RSI is the base indicator among these two, so the calculation of the StochRSI relies on the values of the RSI.
StochRSI = (Most Recent RSI Values – Lowest RSI Over Chosen Period) / (Highest RSI Over Chosen Period – Lowest RSI Over Chosen Period)
When it comes to how to trade using the Stoch RSI indicator, it mostly works the same way as the stochastic indicator.
Conclusion
George Lane said, “momentum always changes direction before price.” Use his stochastic indicator on your forex chart and you’ll find that this is mostly true. However, remember that forex is based on the prices of assets, not their momentums.
So, be careful before you make a trade based on any single indicator. Let other tools confirm your trades before you actually make them.