The Difference Between Overbought and Oversold in Forex Trading
Identifying the difference between overbought and oversold Forex markets can provide the backbone to a number of trading strategies.


If you can make the distinction, then you can shift the odds further in your favour by avoiding going long or short against major market flows.
In summary, an overbought Forex market will have rallied hard. It will then print sustained bullish price action with the expectation being that the market is now due for a drop.
An oversold market on the other hand, has done exactly the opposite. That is, the market has printed sustained bearish price action and pushed lower. The expectation is now that a bounce is to come.
While the law of averages dictates overbought and oversold markets to behave this way, always keep in mind that nothing in Forex trading is a certainty.
Indicators that display overbought and oversold conditions, such as the popular RSI, can only provide so much information on their own.
So let's explore the concept of overbought vs oversold in Forex trading and discuss some strategies around how we can filter the noise and successfully trade these stretched market conditions below.
Differences Between Overbought and Oversold
We start by taking a look at the differences between the overbought and oversold conditions.
Essentially they’re a mirror image of overwhelming control of a market by either buyers or sellers.
Overbought market conditions show the bulls in total control, shown on the chart by an extended move in price to the upside.
Oversold the mirror image of overbought, showing an extended move in price to the downside.
Once price exhibits these extreme market conditions, probabilities say that a market reversal is likely to be on the cards.
Overbought Market Conditions
Overbought market conditions can be visualised on your charts by applying a simple RSI indicator to your trading platform.
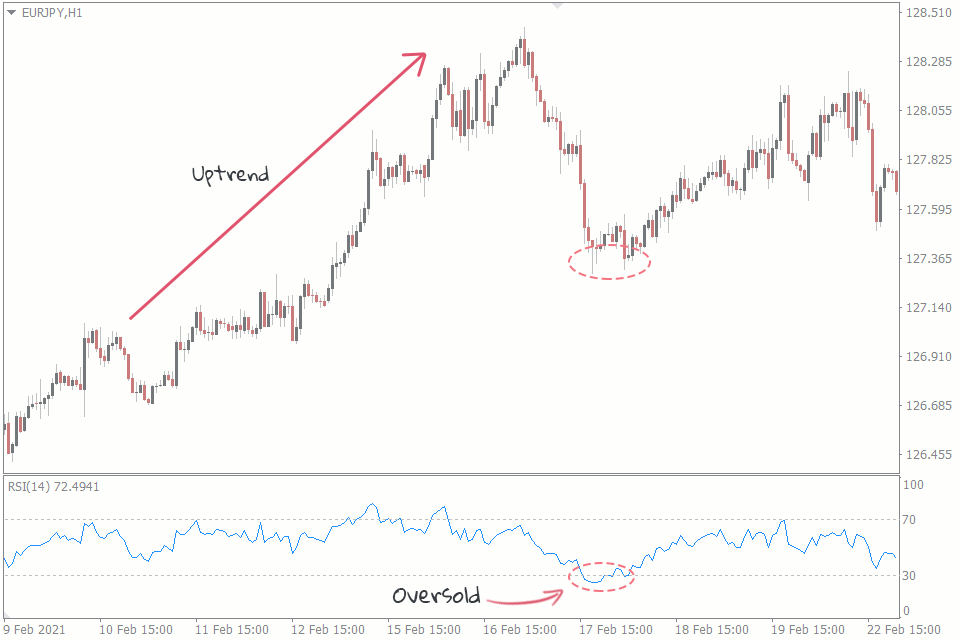
Take a look at what overbought conditions look like on the chart below:
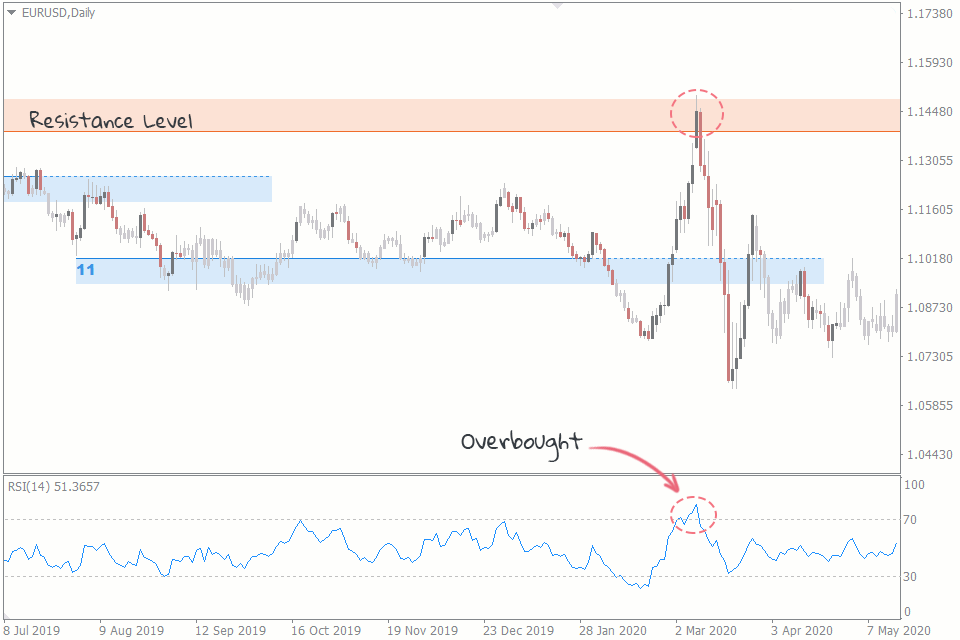
On this particular chart, you can see that the indicator has moved into its upper bounds, with a reading above 70.
Resistance line is plotted using the Support&Resistance indicator.
This signals that the market is overbought and a potential shorting opportunity.
While the term overbought is used to describe a market believed to be trading at its upper bounds, it should never be treated as gospel.
For best results, always use a signal such as this in conjunction with other methods of analysis.
An example of this would be to use trend lines that you’ve identified to indicate that the market is also at resistance.
But more on that in the section below.
Oversold Market Conditions
Oversold market conditions can be visualised on your charts in the exact same way.
Once again, apply the RSI indicator that you’ll find as standard on whichever trading platform you choose to use.
Let’s have a look at what oversold market conditions look like on the chart below:
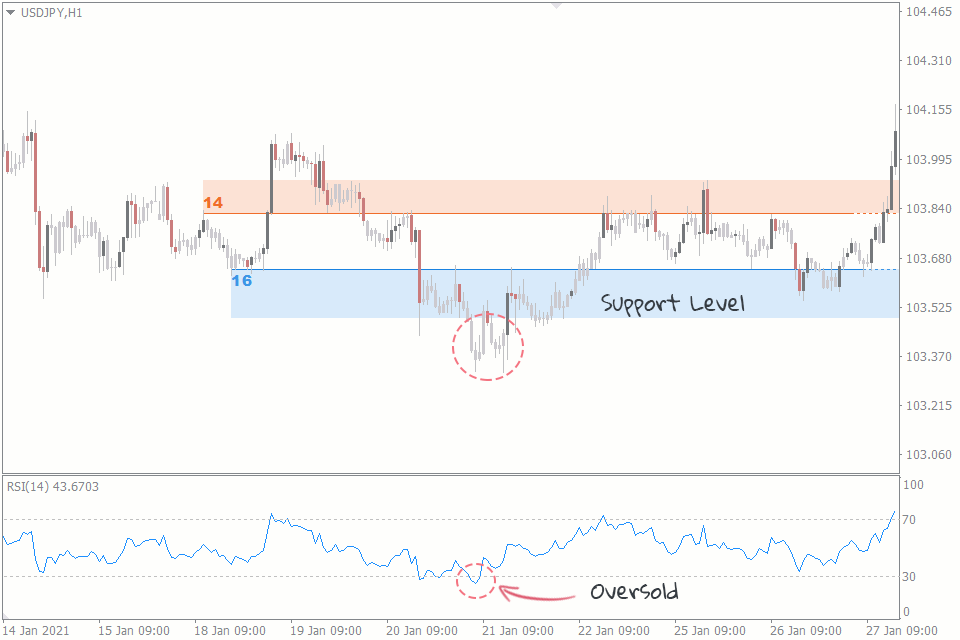
Here you can see that the indicator has moved into its lower bounds, printing a reading of below 30. Again, the support line is plotted using the Support&Resistance indicator.
As oversold is the mirror image of overbought market conditions, this signals that the market now offers a potential opportunity to get long.
Just keep in mind that when a market is oversold, it can continue lower.
…Much lower!
An RSI signal that a market is oversold alone should never be enough for you to immediately buy a dip.
Searching for Confluence is Key
When making a decision to go long or short, overbought and oversold signals should never be used in isolation.
We’re sure you’ve heard the saying that you should never try to catch a falling knife when trading Forex.
That saying is made for trading overbought and oversold signals.
Buying the dip thanks to an oversold indicator reading alone would be the definition of trying to catch a falling knife.
To confirm a reversal in either direction, you’re going to need more.
We mentioned above that you could consider adding trend lines to look for overbought conditions that form as price runs into resistance.
But whichever supplementary forms of market analysis you use, finding confluence in what each of them are indicating is the key.
How to Trade Overbought and Oversold Conditions
Overbought and oversold trading signals are notorious for providing early, or false signals – Especially on the lower time frame charts.
To filter these false signals, let's take a look at a three step trading strategy that, for best results, should be applied to your daily charts.
1. Identify the Prevailing Trend
First of all, we want to identify the prevailing trend.
By understanding which direction the market is trending in, we can then filter out half the RSI signals we receive.
For example, if the market is in a bullish trend, then we should only be looking to take long trades when the market moves into oversold territory.
While we could take small, countertrend short positions when we receive overbought signals, this just adds unnecessary risk.
Don’t swim against the tide if you don’t have to.
2. Identify Key Support/Resistance Zones
Next up, we want to mark all of the major support/resistance zones that are in play.
To mark levels on our chart where price has previously reversed, we can use the FXSSI auto trend line indicator for MT4 alongside the standard horizontal line or Fibonacci retracement tools.
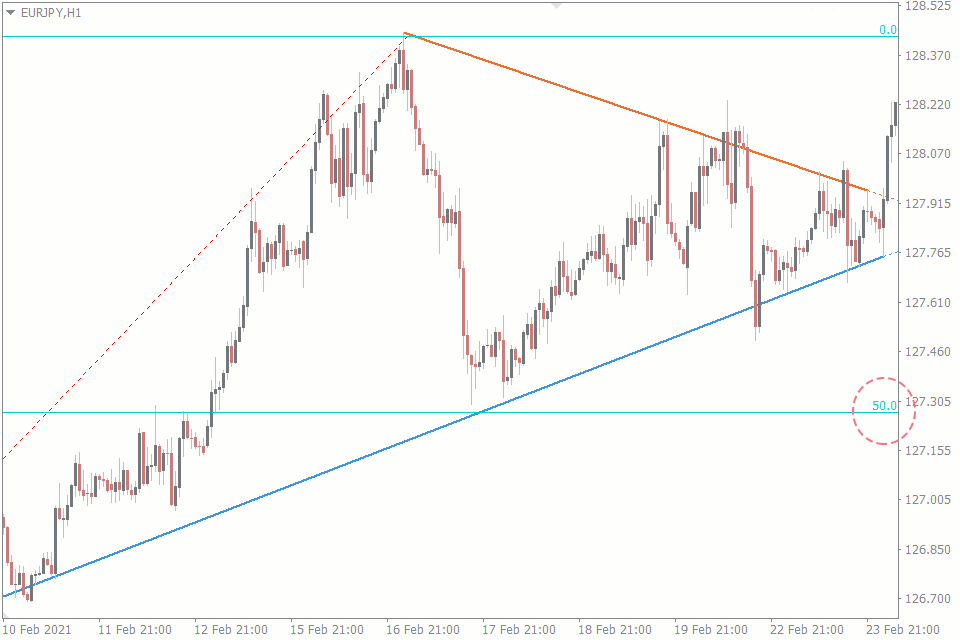
This adds another level of possible confluence within our strategy, signaling that we should only be buying oversold signals at support, within a bullish trend.
As you can see, this adds yet another layer to our strategy.
3. Finally Use Overbought and Oversold Signals
Finally, we use the RSI indicator to provide signals when the market is overbought or oversold.
The key here is that each layer that we’ve added to our strategy, compliments the RSI’s overbought and oversold readings.
We always have to respect the market’s ability to continue higher or lower, deep into overbought and oversold territory respectively.
The layers allow us to filter out overbought and oversold signals that don’t respect the overall conditions of the market we’re trading in.