Divergence: to be or not to be
More specifically, we will test the divergence on classical indicators such as MACD, RSI, and Stochastic.


Probably, each of you has heard about the concept of divergence, read articles about how to find it, and also tried to make money through it. However, none of you might check the effectiveness of divergence and its performance before use it as a whole.
Therefore, we will test the indicators signaling the existence of divergence using our proprietary technique.
Based on the results of tests, we can say exactly how effective the divergence is and whether it makes sense to use it in practice.
Next, we will clarify all the test parameters. If you have read the previous tests, you can skip to the results.
Test Parameters
Objective: Determine the effectiveness of the divergence of classical indicators (RSI, Stochastic, and MACD) with the price.
Strategy: If the indicator shows a pair of falling tops, while the price is rising, it is a signal to sell. If the indicator shows rising bottoms, it is a signal to buy. See more details in the picture:
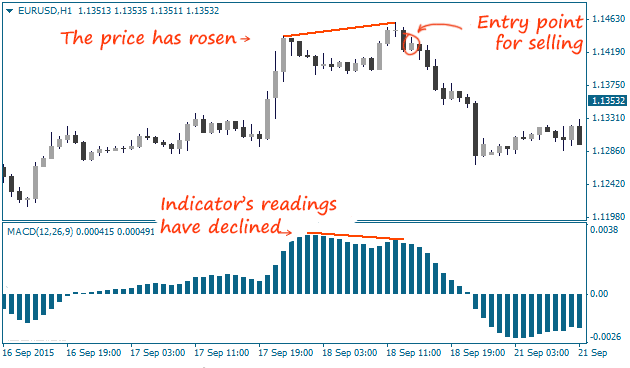
The strategies are the same for RSI and Stochastic indicators.
We’ll determine the existence of divergence using specially prepared indicators.
Indicators’ parameters: standard (just like in the MT4 terminal).
Range of the study: 2012-2015.
Currency pair: EUR/USD.
Timeframes: M1-H4.
Note that the tests will be conducted without taking into account a spread and commissions.
First, we will test all three indicators on M30 timeframe, and then draw up a table including the results shown on other timeframes.
Test #1. MACD Divergence
MACD is the most popular indicator for identifying divergences. MACD readings look smoother as compared to other indicators that make its signals clearer. For the same reason, its signals occur much rarer than those of other indicators.
Extra settings:
- MACD parameters: FastEMA = 12, SlowEMA = 26, and SignalEMA = 9.
- SL = TP = 30 points.
- Timeframe: M30.
Results of the test:

Commentary: The efficiency of the MACD indicator’s divergence was 53.55%, and the average profit per each trade was 2.13 points.
We have got not bad results. The yield curve looks stable but we shouldn’t jump to conclusions. We need to look at the results obtained on other timeframes.
Test #2. Stochastic Divergence
The second thing to be tested is the oscillating Stochastic indicator. It signals divergence much more often that results in more trades.
Settings:
- Stochastic parameters: KPeriod = 5, DPeriod = 3, and Slowing = 3.
- SL = TP = 30 points.
- Timeframe: M30.
Results of the test:
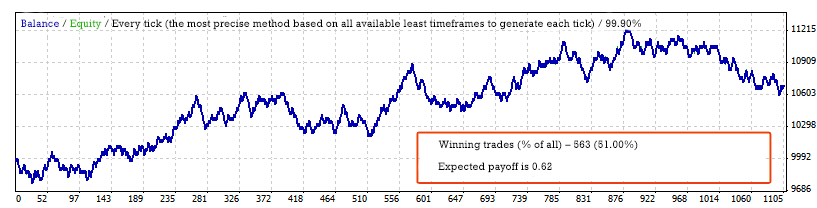
Commentary: The Stochastic didn’t work off as well when compared with the results of the MACD. The efficiency is 51.0%, and the average profit per trade is 0.62 points.
Test #3. RSI Divergence
The last thing to be tested is the RSI indicator divergence. The results are suspected to be not really good, because the RSI indicator itself is not well suited to find divergences.
By the way, we have already tested the RSI indicator itself. You can look at the results.
Extra settings:
- RSI period = 14.
- SL = TP = 30 points.
- Timeframe: M30.
Results of the test:
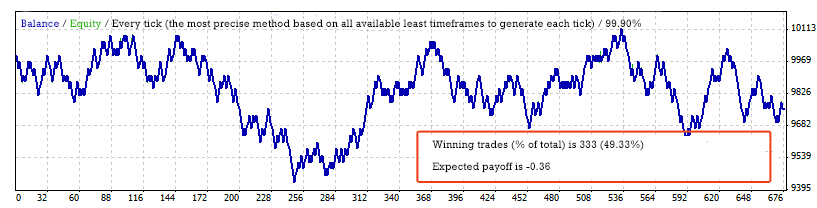
Commentary: The results are absolutely random and no better than those of trading robot that opens trades in a random direction.
The divergence efficiency of the RSI indicator is 49.33%, and the average loss per trade is 0.36 points.
Summary Table of Results
So, we have conducted tests of the divergence on M30 timeframe. Let's test other timeframes and fill in the table.
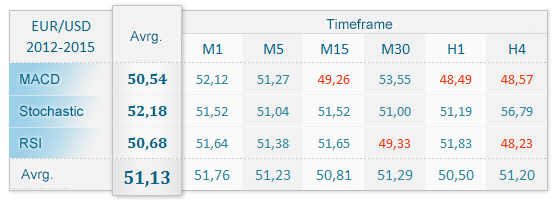
It should also be noted that the divergence signals a price reversal, so you can see a reversal effect on M1-M15 timeframes that slightly improves the test results.
Well, to be or not to be?

Most likely, not to be. The effectiveness of divergence on the charts of classical indicators was 51.13% that doesn’t definitely allow using it in practice.
Why? The answer is that divergence is the same indicator and there are absolutely no reasons why the market should take it into account.
Do you stop using indicators demonstrated low effectiveness after reading this material and other studies?
The fact is that we often receive messages to read as follows: “I don’t know what you have tested there, but for me, Moving Averages work and will always work.”
Is it some kind of stubbornness, or are our tests still not enough informative?
Thank you for your replies.