MACD vs RSI: Which Is Better for Forex Trading?
RSI and MACD are two quite popular indicators in forex. This article discusses how they differ from each other, which is better, and the best ways to use them.


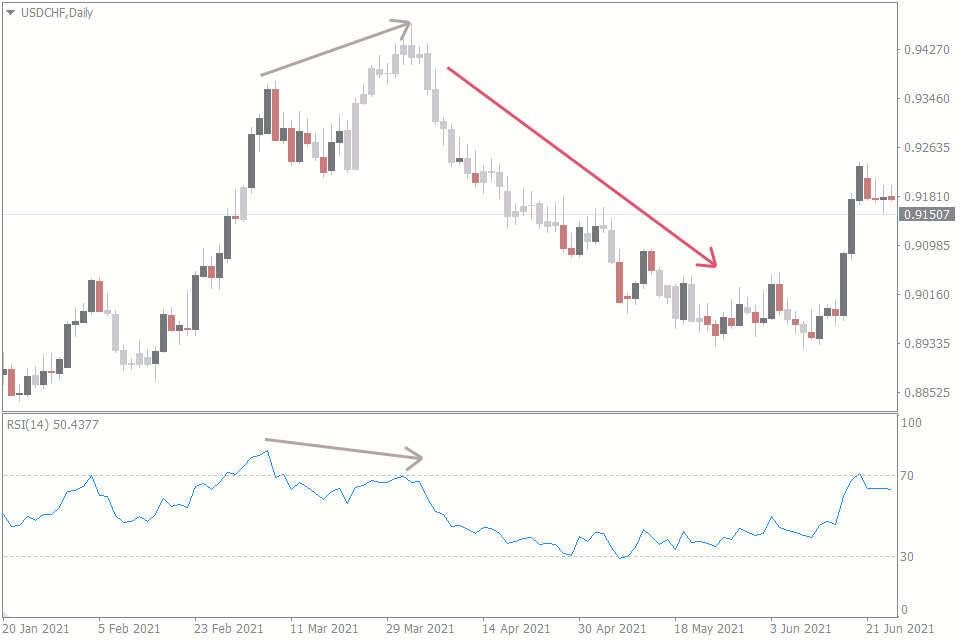
The Relative Strength Indicator (RSI) is a useful indicator for spotting potential reversals by predicting when the currency pair is overbought or oversold. The RSI line oscillates within a scale of 0 to 100.
Anytime the line goes beyond 70, the currency pair is considered to be overbought, and a reversal to the downtrend could be imminent. But when the line falls below 30, the pair is likely to be oversold and a bullish reversal may appear soon.
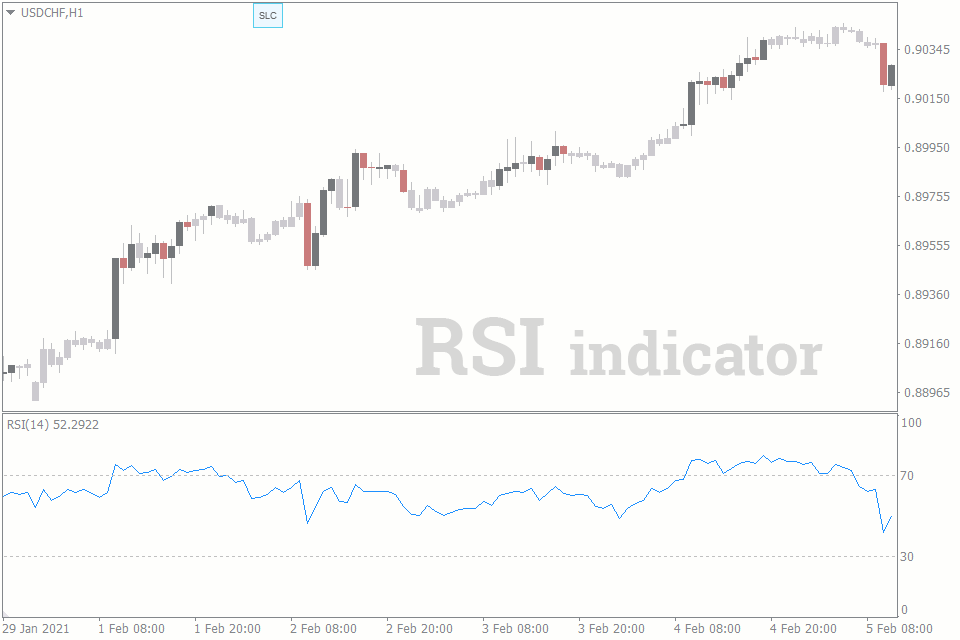
In addition to predicting overbought and oversold pairs, RSI can also be used to trade trends. If the indicator breaks above the 50-level – it's a bullish signal, but a break below the same level indicates a bearish signal.
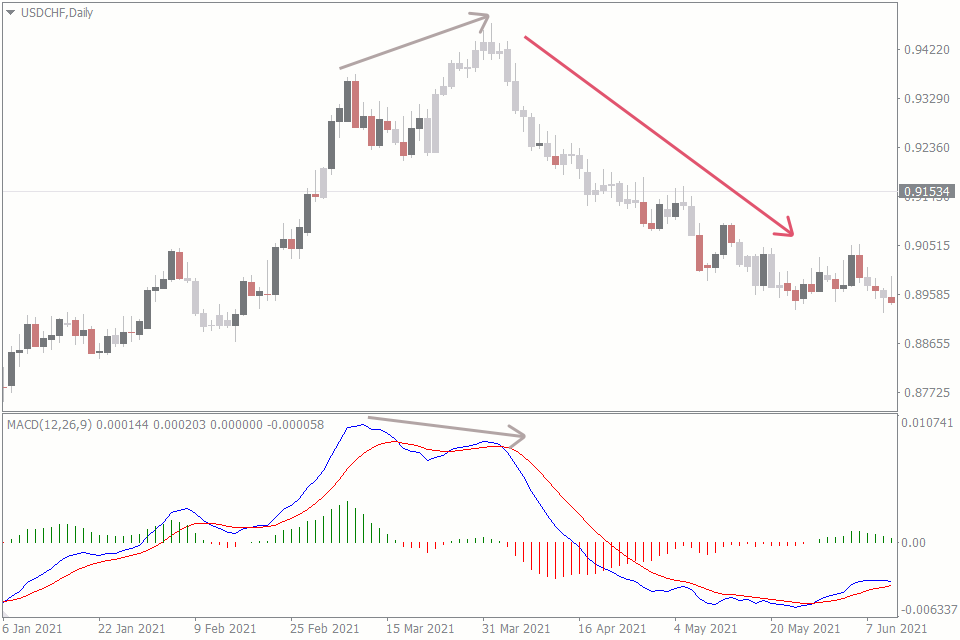
MACD is short for Moving Average Convergence Divergence. The indicator helps you measure the strength of a trend on a forex currency pair. It makes use of two Exponential Moving Averages (often 26-period and 12-period) to form a line called the MACD line. It then uses the 9-period EMA as its signal line. These two lines combine to give out the buy and sell signals.

Don’t be surprised, however, when you open the MACD indicator that comes with the MT4, only to find just one MACD line. This single line is the MACD line.
The crossing of the MACD line to the upside of the zero-line suggests a buy. And if the MACD is on the upside of the zero-line, it suggests a strong bullish momentum. But when it crosses the zero-line to the downtrend, it may mean that the bears have the floor. And having the zero line above the MACD suggests a dominant bearish momentum.
The Differences Between RSI and MACD
Now that we understand what each of these indicators does, let's take a look at the differences between them.
- Although MACD and RSI are both momentum indicators, each goes about its duty using different factors. RSI uses highs and lows of the recent price periods, while MACD uses exponential moving averages.
- Predicting trend reversals through overbought and oversold price levels is the RSI's forte. A trending market, on the other hand, is where MACD thrives.

- Trend reversal traders may enjoy using RSI better, as the indicator’s overbought or oversold signals translate to sell and buy signals, respectively. MACD, on the other hand, would be the pick of many trend traders.
- Don’t expect to get as many signals with RSI when you use it for trend reversals as you would get on the MACD. MACD attempts to give you as many signals within a trend, while RSI just focuses on the reversal of these trends.
Which is Better? RSI or MACD?
The RSI indicator is not better than MACD, and neither is MACD better than RSI. However, there are aspects where RSI performs better than MACD. Similarly, the MACD indicator has some advantages over RSI in some ways. As a result, the better indicator of the two – MACD and RSI – depends on how you use the indicator.
For instance, RSI, in its default setting, doesn't give as many signals as MACD does. But when it does give an overbought/oversold signal, it has a fairly high success rate. As a result, RSI is best used in a trending market where reversals are anticipated. The MACD indicator, on the other hand, could be used to hunt for trend signals in a trending market.
A common shortcoming of both RSI and MACD, however, is how they have low success rates in consolidating markets.
So, Which Should You Use? RSI or MACD?
Which to use between the two indicators – RSI or MACD – heavily depends on your trading style. If you’re a trend trader, you may favor MACD. And as a trend reversal trader, you may find that RSI is a very useful tool. But here are some tips on how to use RSI and MACD.
Tips on Using RSI
- Stick to the overbought and oversold signals of the RSI indicator. There isn't much use for anything else.
- Don’t make a trade the moment you get an overbought or an oversold signal with RSI. That is, when the line crosses above 70 or below 30. This is because the price usually still has the momentum to defy the indicator temporarily. Instead, wait till you get a convincing price action signal on the latest candlestick before you make the trade. Doing this helps limit your loss if the pair completely defies RSI and doesn’t make a reversal at the overbought or oversold level.
- If you’re not a trend reversal trader, you may still find RSI useful when you use it to predict the starts of new trends. The way to go about this is to use RSI to spot reversals on higher timeframes and go to a smaller timeframe to spot new signals in the direction of the reversal.
- RSI usually follows a similar direction to the price. But when a divergence occurs between them, this could mean there’s an impending reversal on the chart.
Tips on Using MACD
- Just like RSI, MACD often follows the same direction as the price. And the divergence in this case also suggests a reversal on the chart.
- The crossover signals of the MACD often lag. So, never use it in a consolidating market. You’ll incur a lot of losses this way. And since MACD is not equipped to tell you when the market is consolidating, use other forex trading tools that predict market consolidations better.
Summary
RSI and MACD are two indicators that are used to predict forex price movements in different forms. While RSI makes use of the open and close values of previous periods, MACD uses EMAs. Another difference between these two indicators is the best way to use them. MACD is best used within a trending market while RSI is best used to spot trend reversals.
But be careful when using these two indicators, or any other indicator. They all give false signals sometimes. The best way to cut your losses when this happens is to always set your stop loss. The Stop Loss Clusters indicator can come in handy here, as it helps you determine where other traders have set their stop losses. With this extra information, you can decide to set your stop-loss where the crowd has put theirs or somewhere around it.
With that said, we have completed our review of which indicator is better – RSI or MACD. You can use this as a guide in your future trading.