Stop Hunt Indicator for MT4 - Shows the Retail Stop Loss Levels
Today we’re going to talk about a simple, but very useful and informative stop hunt indicator for MT4 called StopLossClusters.


This product was developed by the “fxssi.com” project and is available for downloading for participants of the membership club.
Before we proceed to the description of the indicator and its settings, we would like to say a couple of words about why we had an idea to create this indicator, and where data for it comes from.
Reason why it's Important to Know Where Stop Losses of the Crowd are Placed
Every trader knows that it’s necessary to use protective orders for open positions during trading. To this end, numerous techniques are used, and some traders even set Stop Losses in any place on the chart.
Despite the various techniques of setting Stop Losses, they’ll be ultimately distributed unevenly; as a result, clusters of Stop orders will be formed at particular price levels. This is due to the fact that traders are exposed to the same behavioral tricks (also known as “psychological traps”). We described this phenomenon in the article on the stereotypes of the crowd behavior in the market.
It turns out that wherever “weak players” place and hide their protective Stop orders, they’ll be registered and displayed in the order book anyway. Therefore, traders using the “trading against the crowd” strategy receive the most valuable information in this way and see the places where non-professional traders set their Stop Losses.
Indeed, “Stop Losses”, namely, clusters of Stop Losses, is the liquidity, for which the market maker hunts and we must hunt in order to make a profit from trading.
Levels the Crowd is Scared Of
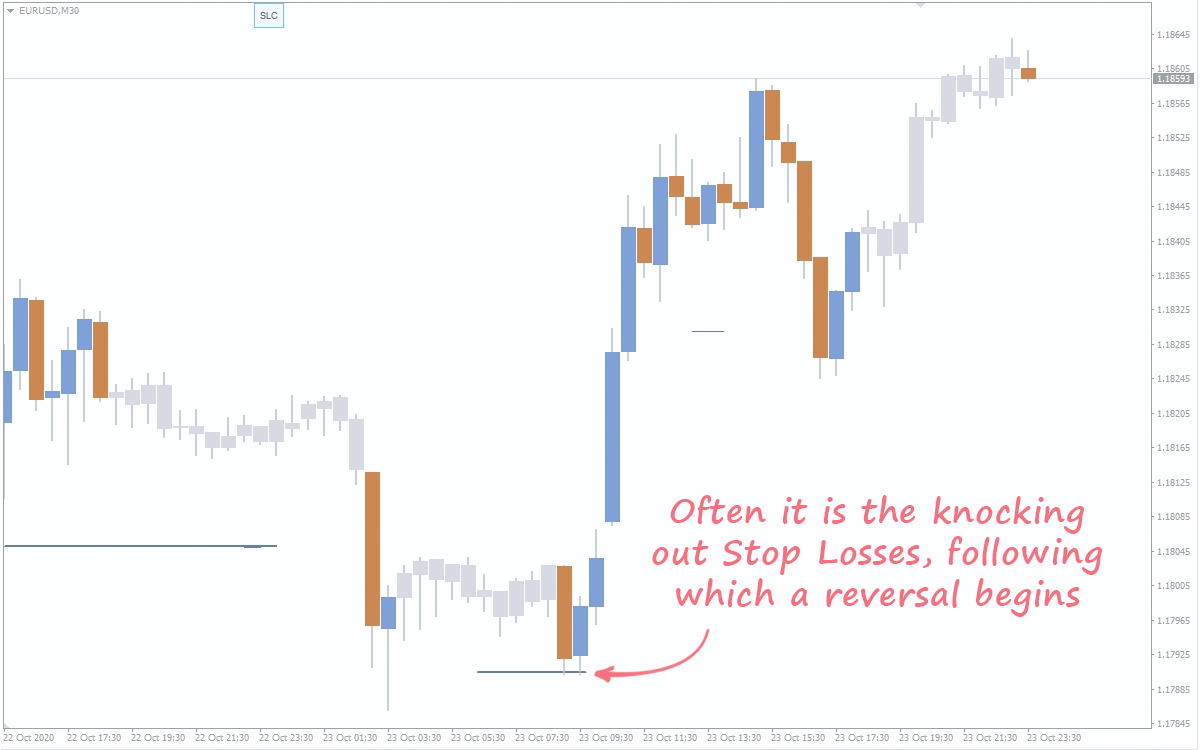
The crowd is mostly scared of the price reaching the levels where its (the crowd’s) Stop Losses are set. This is an obvious thing, because they will incur losses in this case.
It is natural that in most cases the price triggers Stop Losses at these levels. Allow us to demonstrate this “triggering” in the screenshot:
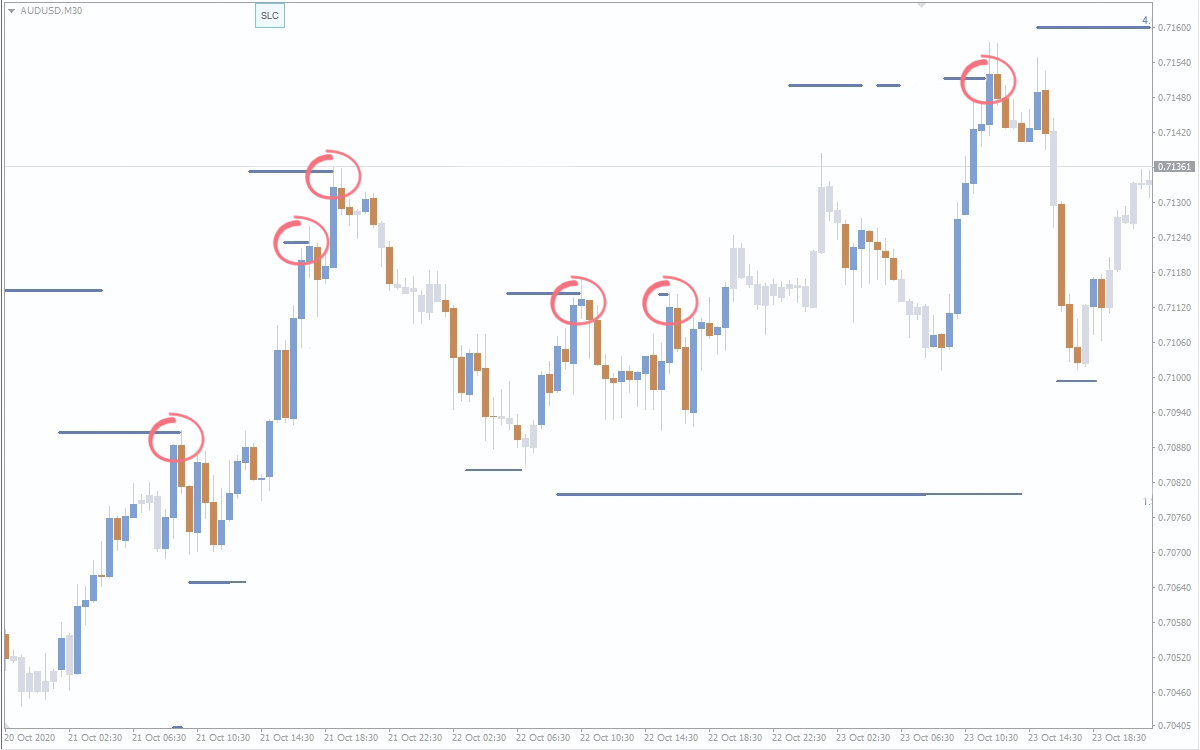
We can see how each cluster closest to the price is “punctured by quotes”. This is explained by the fact that cluster of Stop Losses is an area where there is the liquidity allowing a major player to open a trade at the most favorable price.
Description of the Indicator
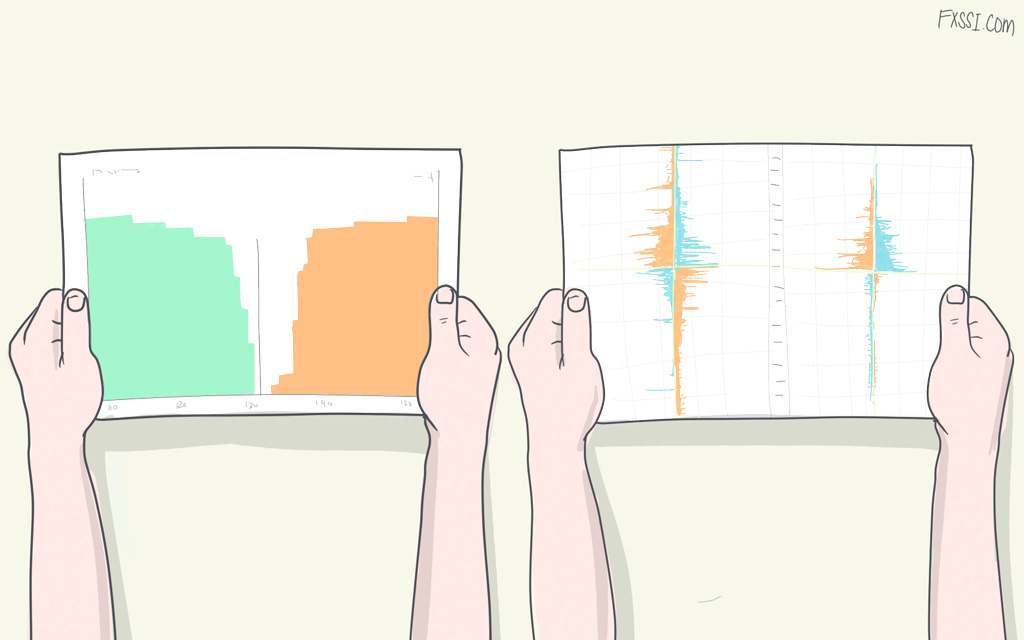
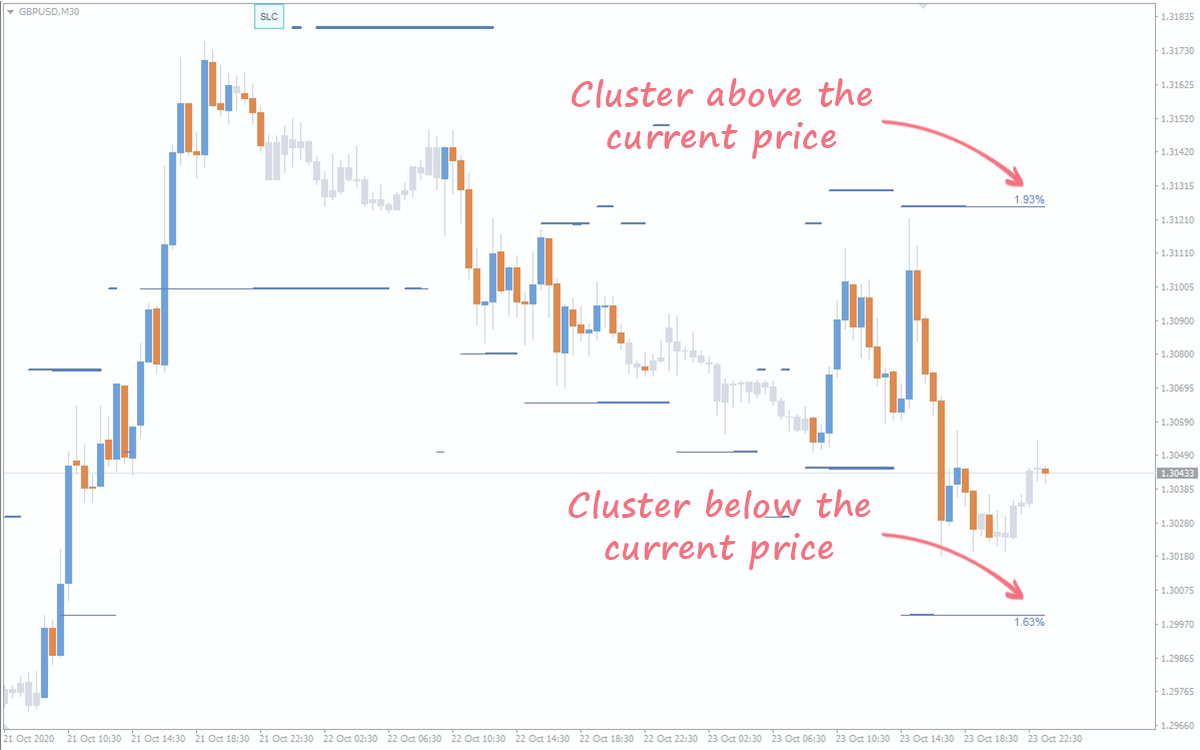
Initially, the feature of the largest clusters of Stop Losses was introduced in the Order Book tool in the form of a single label – GR (Gravity). The decision was made to divide this stop hunt box indicator MT4 into two separate ones in its further development – clusters above the current price and clusters below the current price. Aiming to improve data visualization, we created StopLossClusters indicator for MT4.
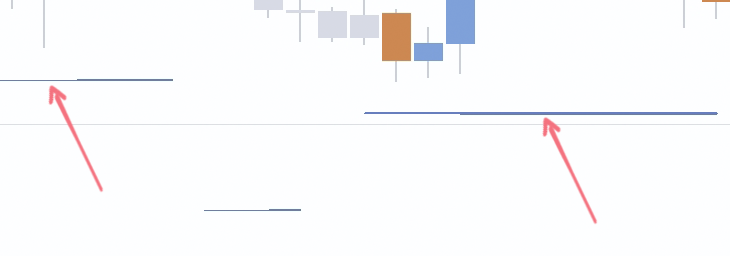
This Stop Hunt indicator displays two clusters of orders (above and below the current price) and their volume on a regular basis, as it is shown in the picture below.
The technique of spotting the clusters works due to a specially “trained” algorithm, which alternately goes through all the values of the levels in the order book until it finds 7 adjacent levels, the sum of which is the maximum value. The given sum is recorded in the database, which we can later see on the chart. The level, which has the maximum value and acts as a reference level for drawing the line of the StopLossClusters indicator on the chart, is also selected from these 7 levels.
Trading With the Indicator
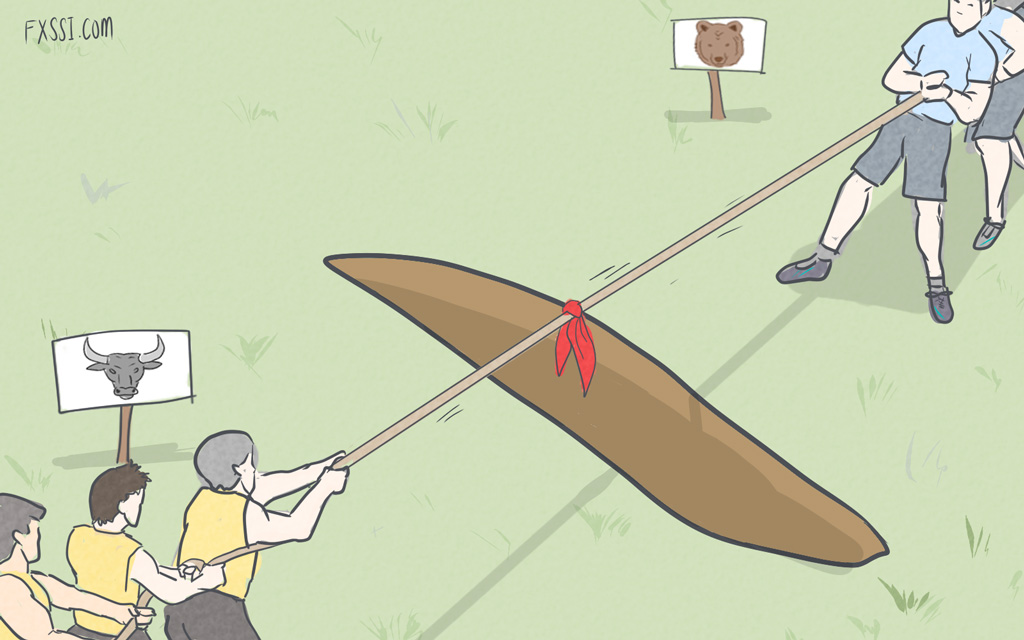
As for the trading technique itself, the following statement is applicable to Stop Losses: “Sell where everyone buys, and buy where everyone sells”. Therefore, if a cluster of Stop Losses is at the top of the market that actually implies Buy trades, we should sell at these levels and can do it in two ways by:
- Closing a previously opened Buy trade by Take Profit.
- Opening a new Sell trade.
In both cases, a seller’s Stop Loss will act as a counterparty of our Sell trade. The same is true for Buy trades: another buyer, who enters the market at more favorable prices, will be counterparty for buyers’ Stop Losses.
The two techniques mentioned above are still slightly different from each other in the ideas underlying them. The first option requires the liquidity so that we can simply exit a trade profitably, following which we don’t care where the price is going to move. The second option can be called the “intake” of liquidity, since we need the price to reverse and move downwards when opening a new trade. Pay attention to it when working with the Forex Stop Hunting indicator.
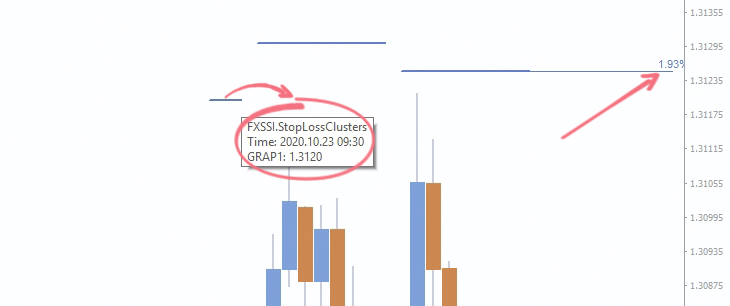
The following picture shows an example of how a cluster of Stop Losses can be used as a turning point while “buying” Stop Losses of buyers:
Main Features of the Indicator
- Volume of clusters. The indicator’s lines display not only the price level, where a cluster was formed, but its volume as well. The clarity of visualization is achieved due to the lines of different thickness.
- Stages of clusters. The indicator supports 3 stages of cluster, with each subsequent having a greater line thickness. You can customize the threshold percentage for every stage of the indicator’s line on your own.
- Label and tooltip. You can see a text label showing the volume size at the last bar at the end of chart.
- Hiding data. You can configure a hotkey to quickly hide the indicator’s lines on the chart or set data hiding as default. It’ll be useful if you’ve completed your analysis using this indicator and want to free up space for analysis. You can download our indicator by clicking the link above, if you’ve paid one of the subscriptions on the website.
Download the ZIP-archive with "FXSSI.StopLossClusters" indicator by clicking the link: