

“Triangle” Pattern: Forex Trading Strategy
The “Triangle” pattern is a simple technical analysis tool in Forex which is a series of falling tops and rising bottoms (4 points are required to draw the pattern).
The “Triangle” pattern is a simple technical analysis tool in Forex which is a series of falling tops and rising bottoms (4 points are required to draw the pattern).

Forex patterns are price models which often repeat in the market and result in certain regularity in the future price behavior.

Let's start this article by asking this question: “How much money can you afford to lose as a result of your next trade?”

Most traders use a trend line (in the future referred to as “TL”) to analyze and make trading decisions, making TL an essential tool for technical analysis.

More specifically, we will test the divergence on classical indicators such as MACD, RSI, and Stochastic.

Today, we'll test Bollinger Bands. They are a set of three moving averages, all of which have the same calculation period. But the standard deviation (price range) is added to or subtracted from the upper and lower ones.

Today, we’re going to test 3 indicators: Relative Strength Index (RSI), Commodity Channel Index (CCI), and, at our reader's request, Williams %R indicator. What do they have in common, and why have we decided to test them together?
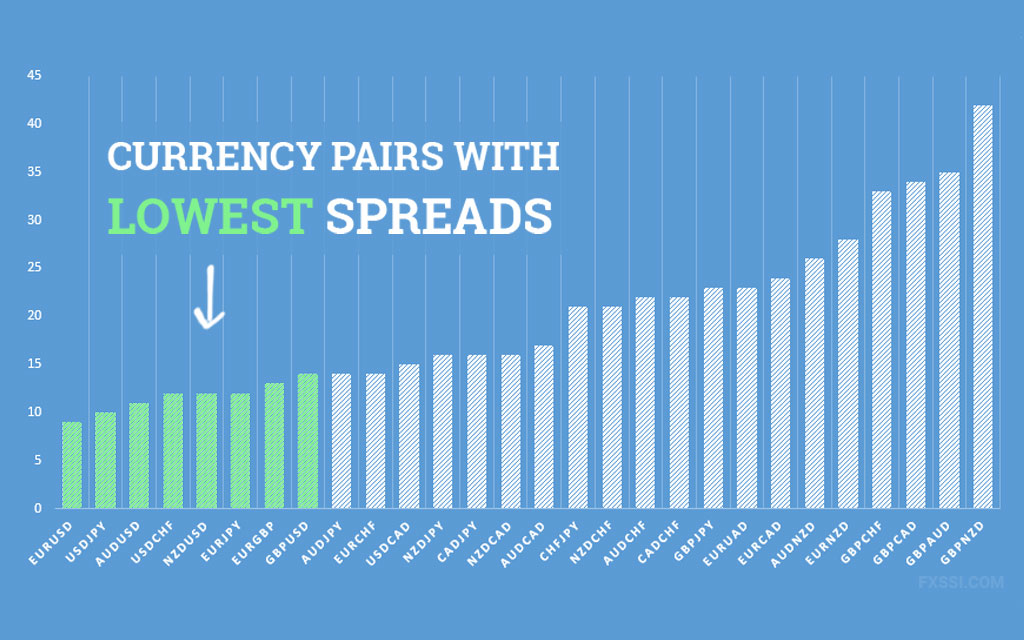
In Forex, the spread is essentially one part of the cost for you as a trader to open any trades. It counts into the total price of trading.
In this article, we’re going to test a classical Moving Average indicator.
Once everything is set up-your trading terminal is active, you've opened several charts, and you're scouting for opportunities – what key questions should you be asking yourself now?